- Area or Line Chart
- Anomaly chart
- Bar chart
- Column chart
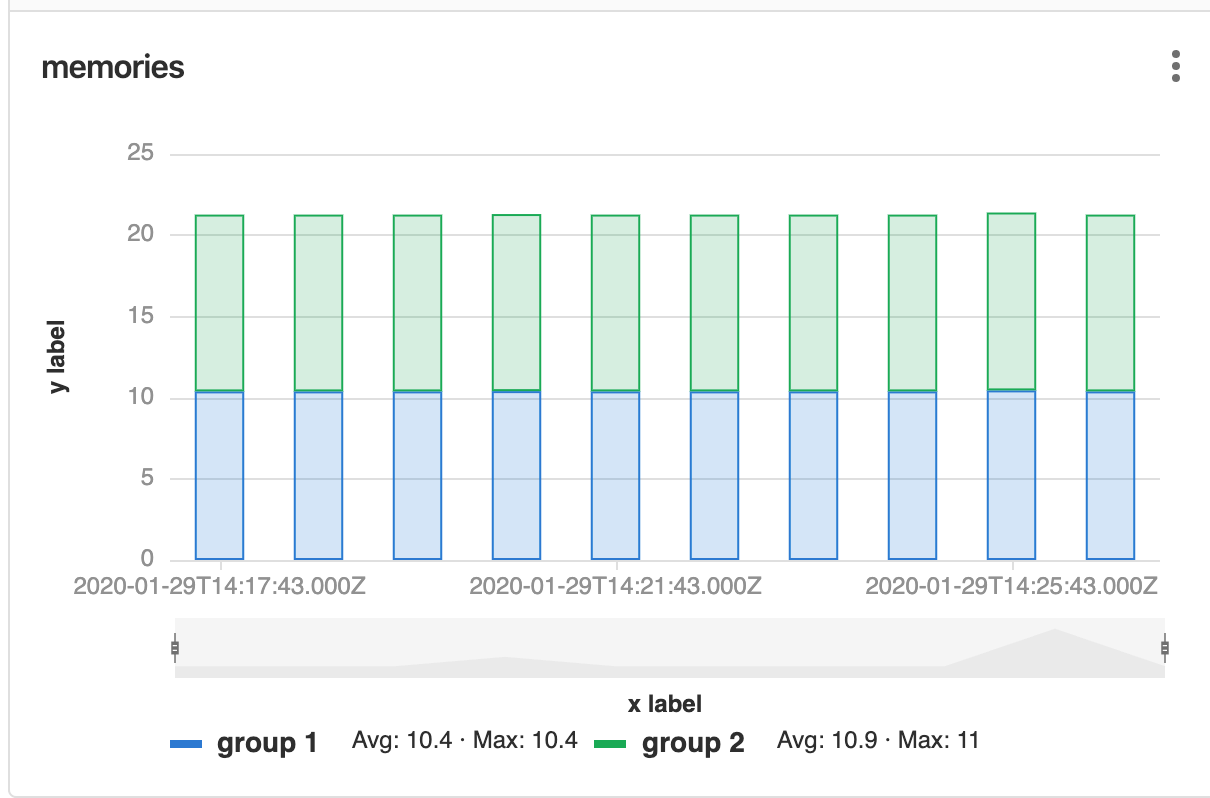
- Stacked column
- Single Stat
- Percentile based results
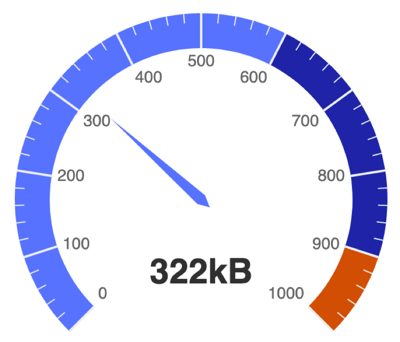
- Gauge
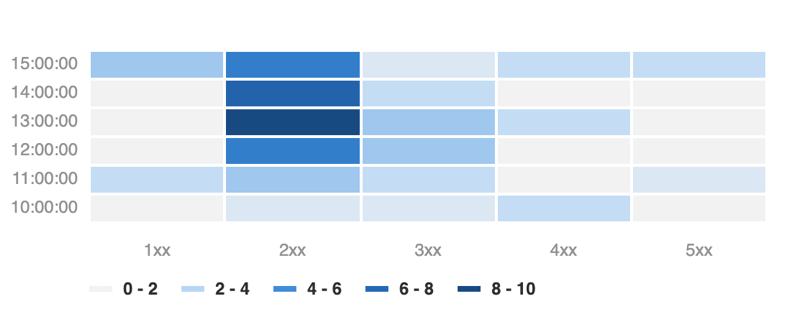
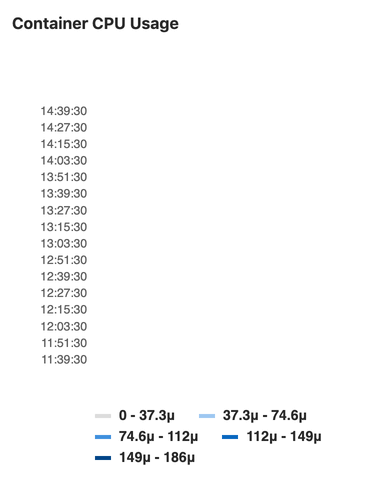
- Heatmaps
Panel types for dashboards
The below panel types are supported in monitoring dashboards.
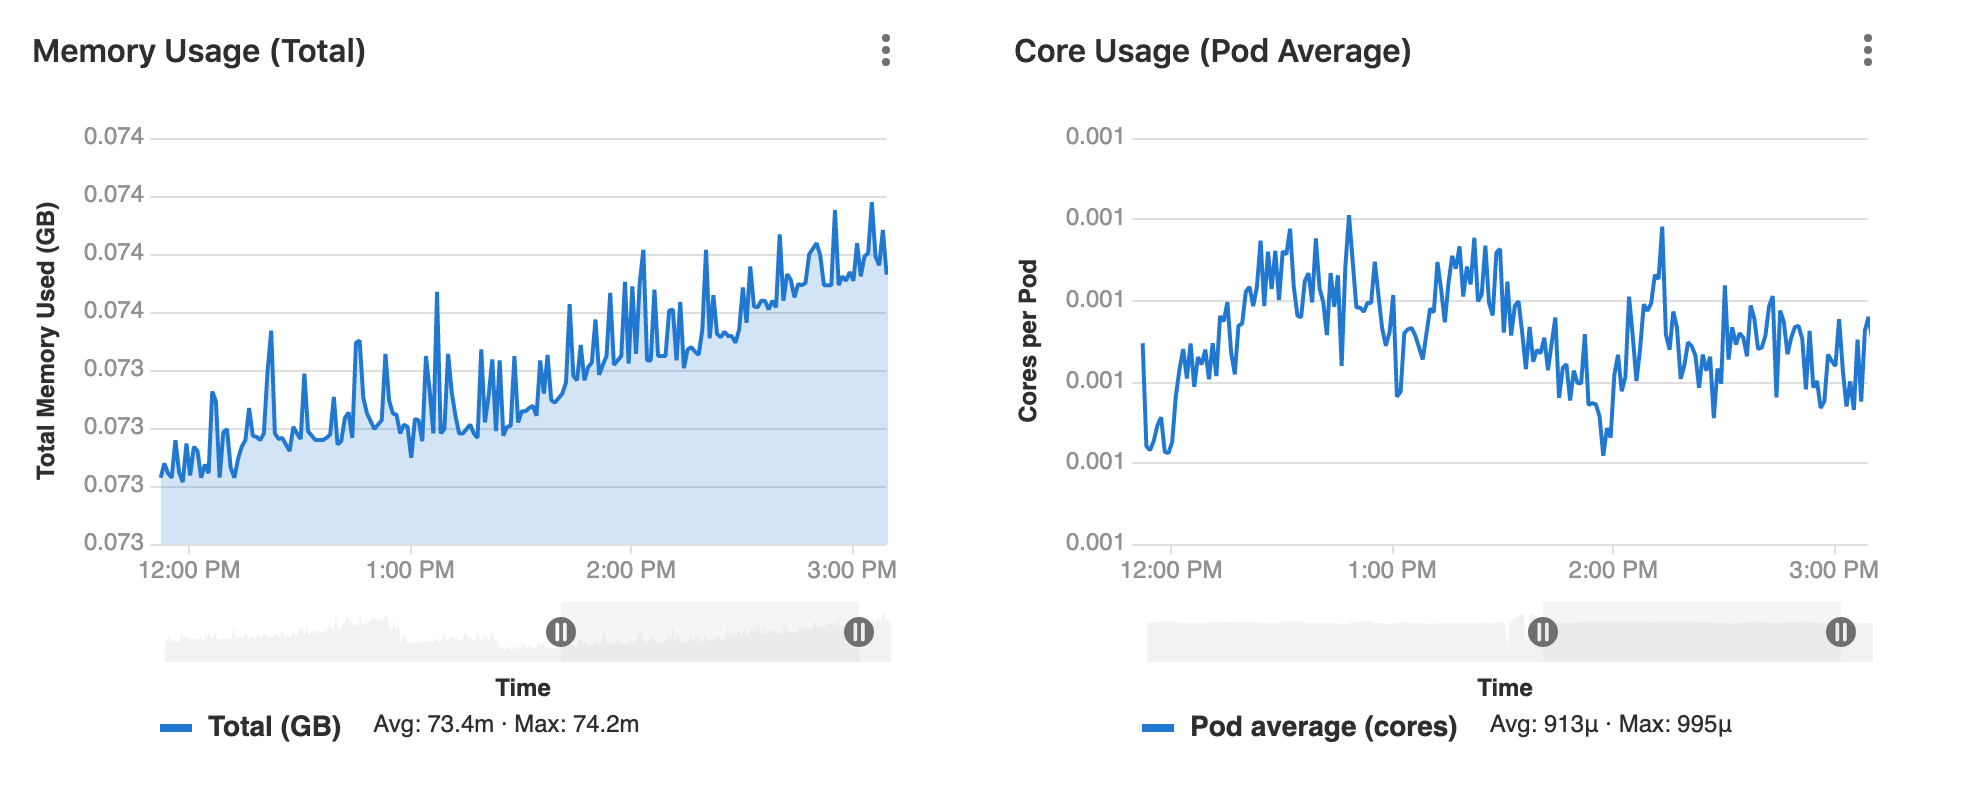
Area or Line Chart
To add an area chart panel type to a dashboard, look at the following sample dashboard file:
dashboard: 'Dashboard Title'
panel_groups:
  - group: 'Group Title'
    panels:
      - type: area-chart  # or line-chart
        title: 'Area Chart Title'
        y_label: 'Y-Axis'
        y_axis:
          format: number
          precision: 0
        metrics:
          - id: area_http_requests_total
            query_range: 'http_requests_total'
            label: 'Instance: {{instance}}, Method: {{method}}'
            unit: "count"
Note the following properties:
| Property | Type | Required | Description |
|---|---|---|---|
| type | string | no | Type of panel to be rendered. Optional for area panel types |
| query_range | string | required | For area panel types, you must use a range query |
Starting in version 12.8, the y-axis values scale according to the data. Previously, it always started from 0.
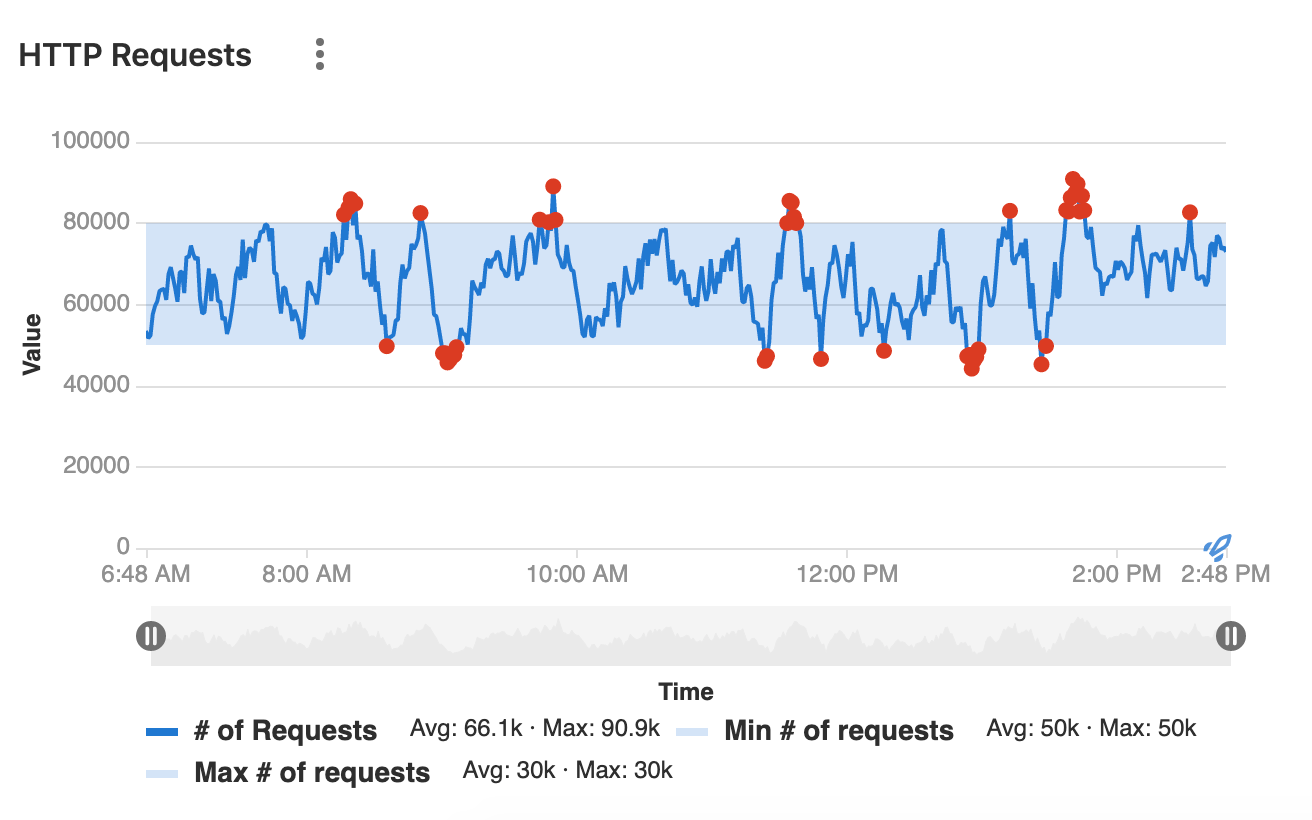
Anomaly chart
Introduced in GitLab 12.5.
To add an anomaly chart panel type to a dashboard, add a panel with exactly 3 metrics.
The first metric represents the current state, and the second and third metrics represent the upper and lower limit respectively:
dashboard: 'Dashboard Title'
panel_groups:
  - group: 'Group Title'
    panels:
      - type: anomaly-chart
        title: 'Chart Title'
        y_label: "Y-Axis"
        metrics:
          - id: anomaly_requests_normal
            query_range: 'http_requests_total'
            label: '# of Requests'
            unit: 'count'
        metrics:
          - id: anomaly_requests_upper_limit
            query_range: 10000
            label: 'Max # of requests'
            unit: 'count'
        metrics:
          - id: anomaly_requests_lower_limit
            query_range: 2000
            label: 'Min # of requests'
            unit: 'count'
Note the following properties:
| Property | Type | Required | Description |
|---|---|---|---|
| type | string | required | Must be anomaly-chart for anomaly panel types
|
| query_range | yes | required | For anomaly panel types, you must use a range query in every metric. |
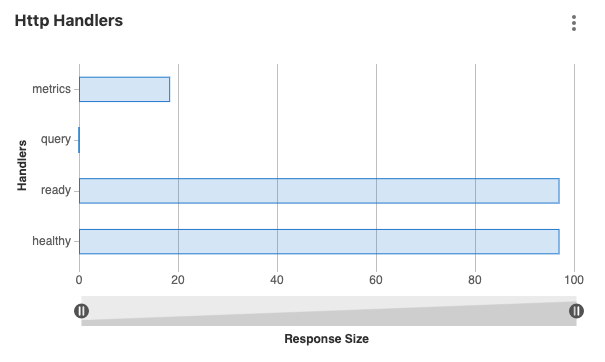
Bar chart
To add a bar chart to a dashboard, look at the following sample dashboard file:
dashboard: 'Dashboard Title'
panel_groups:
  - group: 'Group title'
    panels:
      - type: bar
        title: 'HTTP Handlers'
        x_label: 'Response Size'
        y_axis:
          name: 'Handlers'
        metrics:
          - id: prometheus_http_response_size_bytes_bucket
            query_range: 'sum(increase(prometheus_http_response_size_bytes_bucket[1d])) by (handler)'
            unit: 'Bytes'
Note the following properties:
| Property | Type | Required | Description |
|---|---|---|---|
type
| string | yes | Type of panel to be rendered. For bar chart types, set to bar
|
query_range
| yes | yes | For bar chart, you must use a range query |
Column chart
To add a column panel type to a dashboard, look at the following sample dashboard file:
dashboard: 'Dashboard Title'
panel_groups:
  - group: 'Group title'
    panels:
      - title: 'Column'
        type: 'column'
        metrics:
        - id: 1024_memory
          query: 'avg(sum(container_memory_usage_bytes{container_name!="POD",pod_name=~"^%{ci_environment_slug}-([^c].*|c([^a]|a([^n]|n([^a]|a([^r]|r[^y])))).*|)-(.*)",namespace="%{kube_namespace}"}) by (job)) without (job) / count(avg(container_memory_usage_bytes{container_name!="POD",pod_name=~"^%{ci_environment_slug}-([^c].*|c([^a]|a([^n]|n([^a]|a([^r]|r[^y])))).*|)-(.*)",namespace="%{kube_namespace}"}) without (job)) /1024/1024'
          unit: MB
          label: 'Memory Usage'
Note the following properties:
| Property | Type | Required | Description |
|---|---|---|---|
| type | string | yes | Type of panel to be rendered. For column panel types, set to column
|
| query_range | yes | yes | For column panel types, you must use a range query |
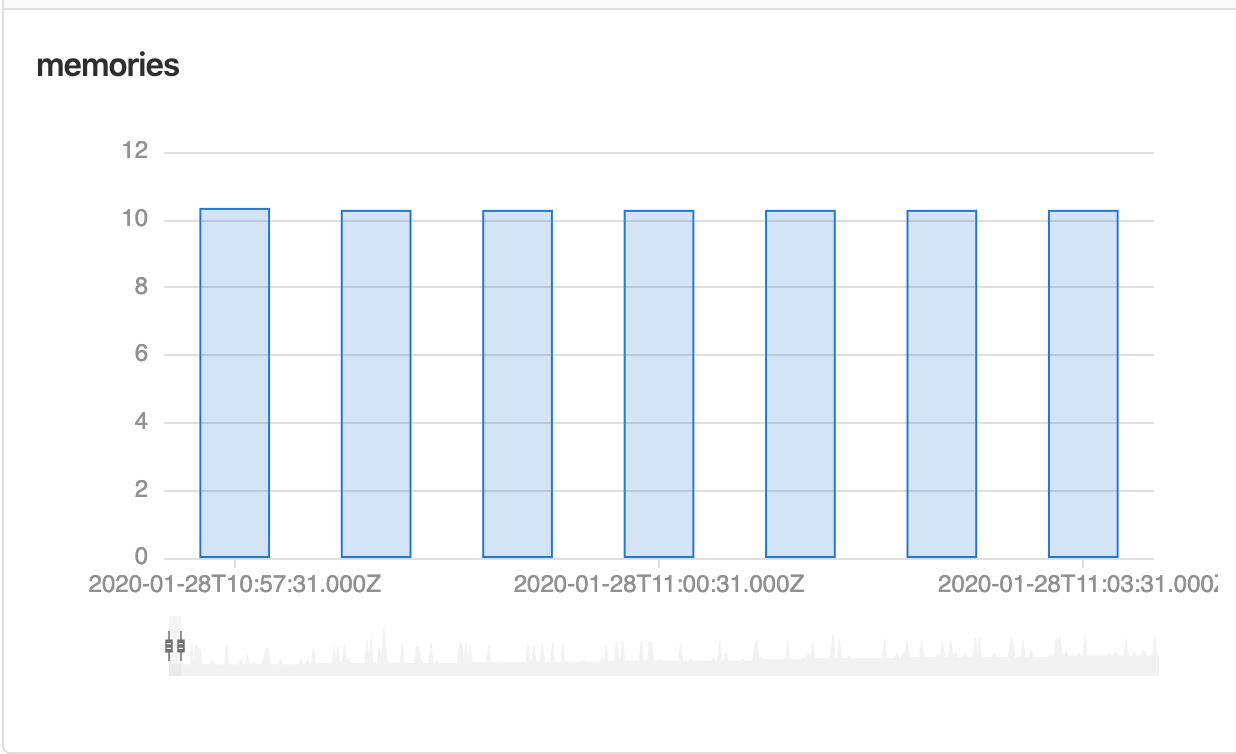
Stacked column
Introduced in GitLab 12.8.
To add a stacked column panel type to a dashboard, look at the following sample dashboard file:
dashboard: 'Dashboard title'
priority: 1
panel_groups:
  - group: 'Group Title'
    priority: 5
    panels:
      - type: 'stacked-column'
        title: 'Stacked column'
        y_label: 'y label'
        x_label: 'x label'
        metrics:
          - id: memory_1
            query_range: 'memory_query'
            label: 'memory query 1'
            unit: 'count'
            series_name: 'group 1'
          - id: memory_2
            query_range: 'memory_query_2'
            label: 'memory query 2'
            unit: 'count'
            series_name: 'group 2'
| Property | Type | Required | Description |
|---|---|---|---|
type
| string | yes | Type of panel to be rendered. For stacked column panel types, set to stacked-column
|
query_range
| yes | yes | For stacked column panel types, you must use a range query |
Single Stat
To add a single stat panel type to a dashboard, look at the following sample dashboard file:
dashboard: 'Dashboard Title'
panel_groups:
  - group: 'Group Title'
    panels:
      - title: 'Single Stat'
        type: 'single-stat'
        metrics:
          - id: 10
            query: 'max(go_memstats_alloc_bytes{job="prometheus"})'
            unit: MB
            label: 'Total'
Note the following properties:
| Property | Type | Required | Description |
|---|---|---|---|
| type | string | yes | Type of panel to be rendered. For single stat panel types, set to single-stat
|
| field | string | no | Panels display the value of a metric. For a panel to display the value of a label instead, put the name of the label in this key. |
| query | string | yes | For single stat panel types, you must use an instant query |
Percentile based results
Introduced in GitLab 12.8.
Query results sometimes need to be represented as a percentage value out of 100. You can use the max_value property at the root of the panel definition:
dashboard: 'Dashboard Title'
panel_groups:
  - group: 'Group Title'
    panels:
      - title: 'Single Stat'
        type: 'single-stat'
        max_value: 100
        metrics:
          - id: 10
            query: 'max(go_memstats_alloc_bytes{job="prometheus"})'
            unit: '%'
            label: 'Total'
For example, if you have a query value of 53.6, adding % as the unit results in a single stat value of 53.6%, but if the maximum expected value of the query is 120, the value would be 44.6%. Adding the max_value causes the correct percentage value to display.
Gauge
Introduced in GitLab 13.3.
To add a gauge panel type to a dashboard, look at the following sample dashboard file:
dashboard: 'Dashboard Title'
panel_groups:
  - group: 'Group Title'
    panels:
      - title: 'Gauge'
        type: 'gauge'
        min_value: 0
        max_value: 1000
        split: 5
        thresholds:
          values: [60, 90]
          mode: 'percentage'
        format: 'kilobytes'
        metrics:
          - id: 10
            query: 'floor(max(prometheus_http_response_size_bytes_bucket)/1000)'
            unit: 'kb'
Note the following properties:
| Property | Type | Required | Description |
|---|---|---|---|
| type | string | yes | Type of panel to be rendered. For gauge panel types, set to gauge.
|
| min_value | number | no, defaults to 0
| The minimum value of the gauge chart axis. If either of min_value or max_value are not set, they both get their default values.
|
| max_value | number | no, defaults to 100
| The maximum value of the gauge chart axis. If either of min_value or max_value are not set, they both get their default values.
|
| split | number | no, defaults to 10
| The amount of split segments on the gauge chart axis. |
| thresholds | object | no | Thresholds configuration for the gauge chart axis. |
| format | string | no, defaults to engineering
| Unit format used. See the full list of units. |
| query | string | yes | For gauge panel types, you must use an instant query. |
Thresholds properties
| Property | Type | Required | Description |
|---|---|---|---|
| values | array | no, defaults to 95% of the range between min_value and max_value
| An array of gauge chart axis threshold values. |
| mode | string | no, defaults to absolute
| The mode in which the thresholds are interpreted in relation to min_value and max_value. Can be either percentage or absolute.
|
Heatmaps
Introduced in GitLab 12.5.
To add a heatmap panel type to a dashboard, look at the following sample dashboard file:
dashboard: 'Dashboard Title'
panel_groups:
  - group: 'Group Title'
    panels:
      - title: 'Heatmap'
        type: 'heatmap'
        metrics:
          - id: 10
            query: 'sum(rate(nginx_upstream_responses_total{upstream=~"%{kube_namespace}-%{ci_environment_slug}-.*"}[60m])) by (status_code)'
            unit: req/sec
            label: 'Status code'
Note the following properties:
| Property | Type | Required | Description |
|---|---|---|---|
| type | string | yes | Type of panel to be rendered. For heatmap panel types, set to heatmap
|
| query_range | yes | yes | For area panel types, you must use a range query |
