
极狐GitLab Runner 从 1.8.0 引入了对 Prometheus metrics 的原生支持。Runner 目前对外输出的信息有:
- Runner 的业务逻辑指标(诸如当前运行 Job 的数量)
- Go 相关的进程指标(诸如 gc、goroutines、memstats 等)
- 通用的进程指标(比如 memory usage、 CPU usage、file descriptor usage 等)
- 构建的版本信息
下面使用 Prometheus + Grafana来实现 Runner 指标的监控。
前提条件
- 处于运行状态的 Runner
- 一个 Prometheus 实例
- 一个 Grafana 实例
Runner 的安装
Runner 的安装有多种方法,papckage、docker、helm 等,详细的安装使用可以查看 Runner 的花式玩法。
本文用 docker 的方式拉起了一个 Runner 实例,为了获取 metrics,同步开启了 9252 端口:
$ docker run -d --name gitlab-runner-docker  \
    --restart always -v $PWD:/etc/gitlab-runner  \
    -p 9252:9252    -v /var/run/docker.sock:/var/run/docker.sock   \
    gitlab/gitlab-runner:latest
为了测试用,使用 gitlab-runenr register 注册了 6 次:
$ gitlab-runner list
Runtime platform                                    arch=amd64 os=linux pid=353 revision=43b2dc3d version=15.4.0
Listing configured runners                          ConfigFile=/etc/gitlab-runner/config.toml
runner-1                                            Executor=docker Token=rGSszVLSiYxQzcpVm8ud URL=https://jihulab.com/
runner-2                                            Executor=docker Token=7r8bfWJRVaeMsCCQ3R2m URL=https://jihulab.com/
runner-3                                            Executor=docker Token=3xqRCdMdo9VYuwb92Gfr URL=https://jihulab.com/
runner-4                                            Executor=docker Token=jAeBYLSNCCkaspAbmTsA URL=https://jihulab.com/
runner-5                                            Executor=docker Token=DAGXrJoNHYKNuwwNUVD5 URL=https://jihulab.com/
runner-6                                            Executor=docker Token=V_sAUz2C-fVba5CfQxjA URL=https://jihulab.com/
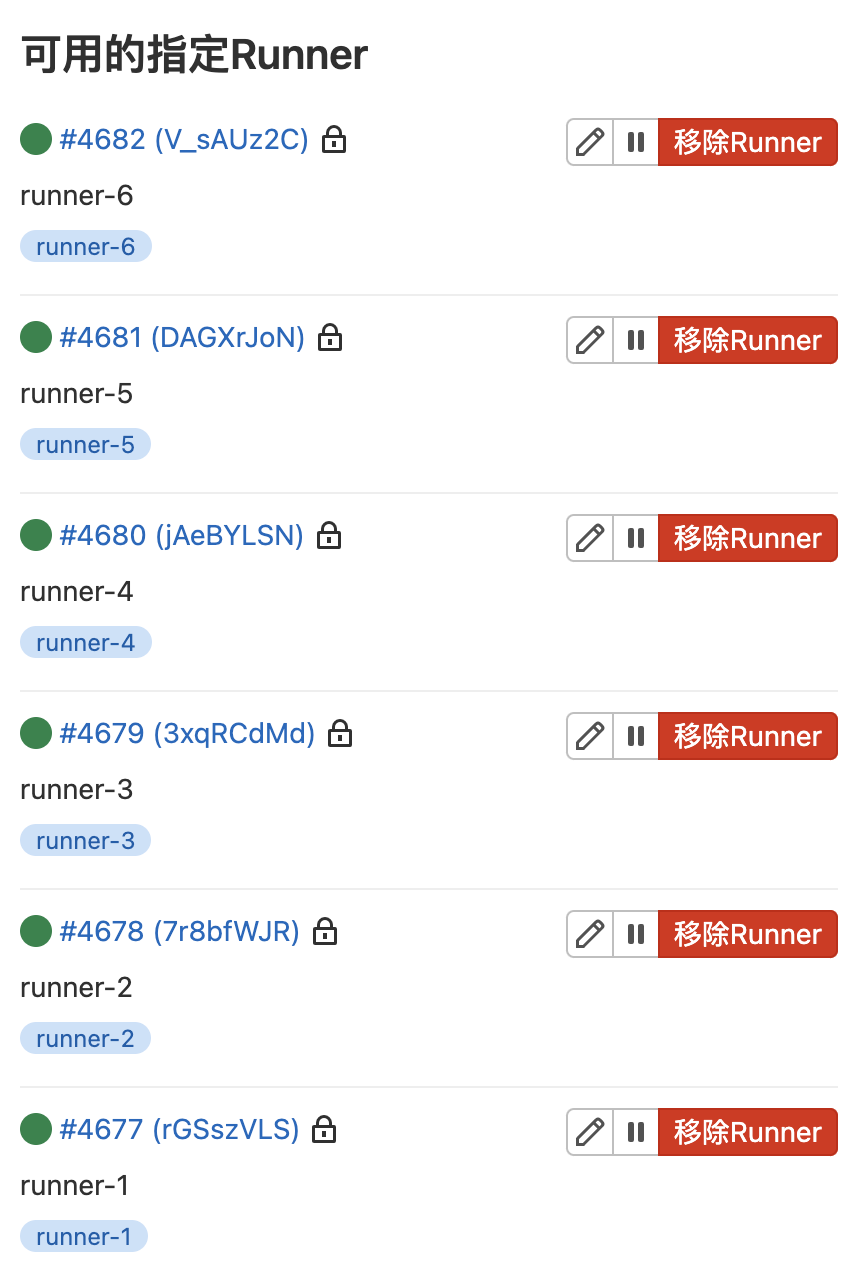
在极狐GitLab 的项目 → 设置 → CI/CD → Runner 里面可以看到 6 个 Runner 处于 active 状态:
由于 Runner 的 metrics 是通过 9252 端口输出的,需要在 Runner 的 config.toml 文件中配置 listen_address 参数,本文的配置为:
$ listen_address = "0.0.0.0:9252"
可以根据自身实际情况进行配置。
然后通过下面的命令查看可用的 metrics:
$ curl -s "http://localhost:9252/metrics" | grep -E "# HELP"
# HELP gitlab_runner_api_request_statuses_total The total number of api requests, partitioned by runner, endpoint and status.
# HELP gitlab_runner_autoscaling_machine_creation_duration_seconds Histogram of machine creation time.
# HELP gitlab_runner_autoscaling_machine_failed_creation_duration_seconds Histogram of machine failed creation timings
# HELP gitlab_runner_autoscaling_machine_removal_duration_seconds Histogram of machine removal time.
# HELP gitlab_runner_autoscaling_machine_states The current number of machines per state in this provider.
# HELP gitlab_runner_autoscaling_machine_stopping_duration_seconds Histogram of machine stopping time.
# HELP gitlab_runner_concurrent The current value of concurrent setting
# HELP gitlab_runner_errors_total The number of caught errors.
# HELP gitlab_runner_job_duration_seconds Histogram of job durations
# HELP gitlab_runner_jobs The current number of running builds.
# HELP gitlab_runner_jobs_total Total number of handled jobs
# HELP gitlab_runner_limit The current value of concurrent setting
# HELP gitlab_runner_request_concurrency The current number of concurrent requests for a new job
# HELP gitlab_runner_request_concurrency_exceeded_total Counter tracking exceeding of request concurrency
# HELP gitlab_runner_version_info A metric with a constant '1' value labeled by different build stats fields.
# HELP go_gc_duration_seconds A summary of the pause duration of garbage collection cycles.
# HELP go_goroutines Number of goroutines that currently exist.
# HELP go_info Information about the Go environment.
# HELP go_memstats_alloc_bytes Number of bytes allocated and still in use.
# HELP go_memstats_alloc_bytes_total Total number of bytes allocated, even if freed.
# HELP go_memstats_buck_hash_sys_bytes Number of bytes used by the profiling bucket hash table.
# HELP go_memstats_frees_total Total number of frees.
# HELP go_memstats_gc_cpu_fraction The fraction of this program's available CPU time used by the GC since the program started.
# HELP go_memstats_gc_sys_bytes Number of bytes used for garbage collection system metadata.
# HELP go_memstats_heap_alloc_bytes Number of heap bytes allocated and still in use.
# HELP go_memstats_heap_idle_bytes Number of heap bytes waiting to be used.
# HELP go_memstats_heap_inuse_bytes Number of heap bytes that are in use.
# HELP go_memstats_heap_objects Number of allocated objects.
# HELP go_memstats_heap_released_bytes Number of heap bytes released to OS.
# HELP go_memstats_heap_sys_bytes Number of heap bytes obtained from system.
# HELP go_memstats_last_gc_time_seconds Number of seconds since 1970 of last garbage collection.
# HELP go_memstats_lookups_total Total number of pointer lookups.
# HELP go_memstats_mallocs_total Total number of mallocs.
# HELP go_memstats_mcache_inuse_bytes Number of bytes in use by mcache structures.
# HELP go_memstats_mcache_sys_bytes Number of bytes used for mcache structures obtained from system.
# HELP go_memstats_mspan_inuse_bytes Number of bytes in use by mspan structures.
# HELP go_memstats_mspan_sys_bytes Number of bytes used for mspan structures obtained from system.
# HELP go_memstats_next_gc_bytes Number of heap bytes when next garbage collection will take place.
# HELP go_memstats_other_sys_bytes Number of bytes used for other system allocations.
# HELP go_memstats_stack_inuse_bytes Number of bytes in use by the stack allocator.
# HELP go_memstats_stack_sys_bytes Number of bytes obtained from system for stack allocator.
# HELP go_memstats_sys_bytes Number of bytes obtained from system.
# HELP go_threads Number of OS threads created.
# HELP process_cpu_seconds_total Total user and system CPU time spent in seconds.
# HELP process_max_fds Maximum number of open file descriptors.
# HELP process_open_fds Number of open file descriptors.
# HELP process_resident_memory_bytes Resident memory size in bytes.
# HELP process_start_time_seconds Start time of the process since unix epoch in seconds.
# HELP process_virtual_memory_bytes Virtual memory size in bytes.
# HELP process_virtual_memory_max_bytes Maximum amount of virtual memory available in bytes.
这些指标就是可以被 prometheus 抓取并且通过 Grafana 进行展示的。
Prometheus 的安装
Prometheus 的安装可以参考 Prometheus 官网文档,本文用 docker 拉起一个 prometheus 实例:
$ docker run -d -p 9090:9090 -v $PWD:/etc/prometheus prom/prometheus
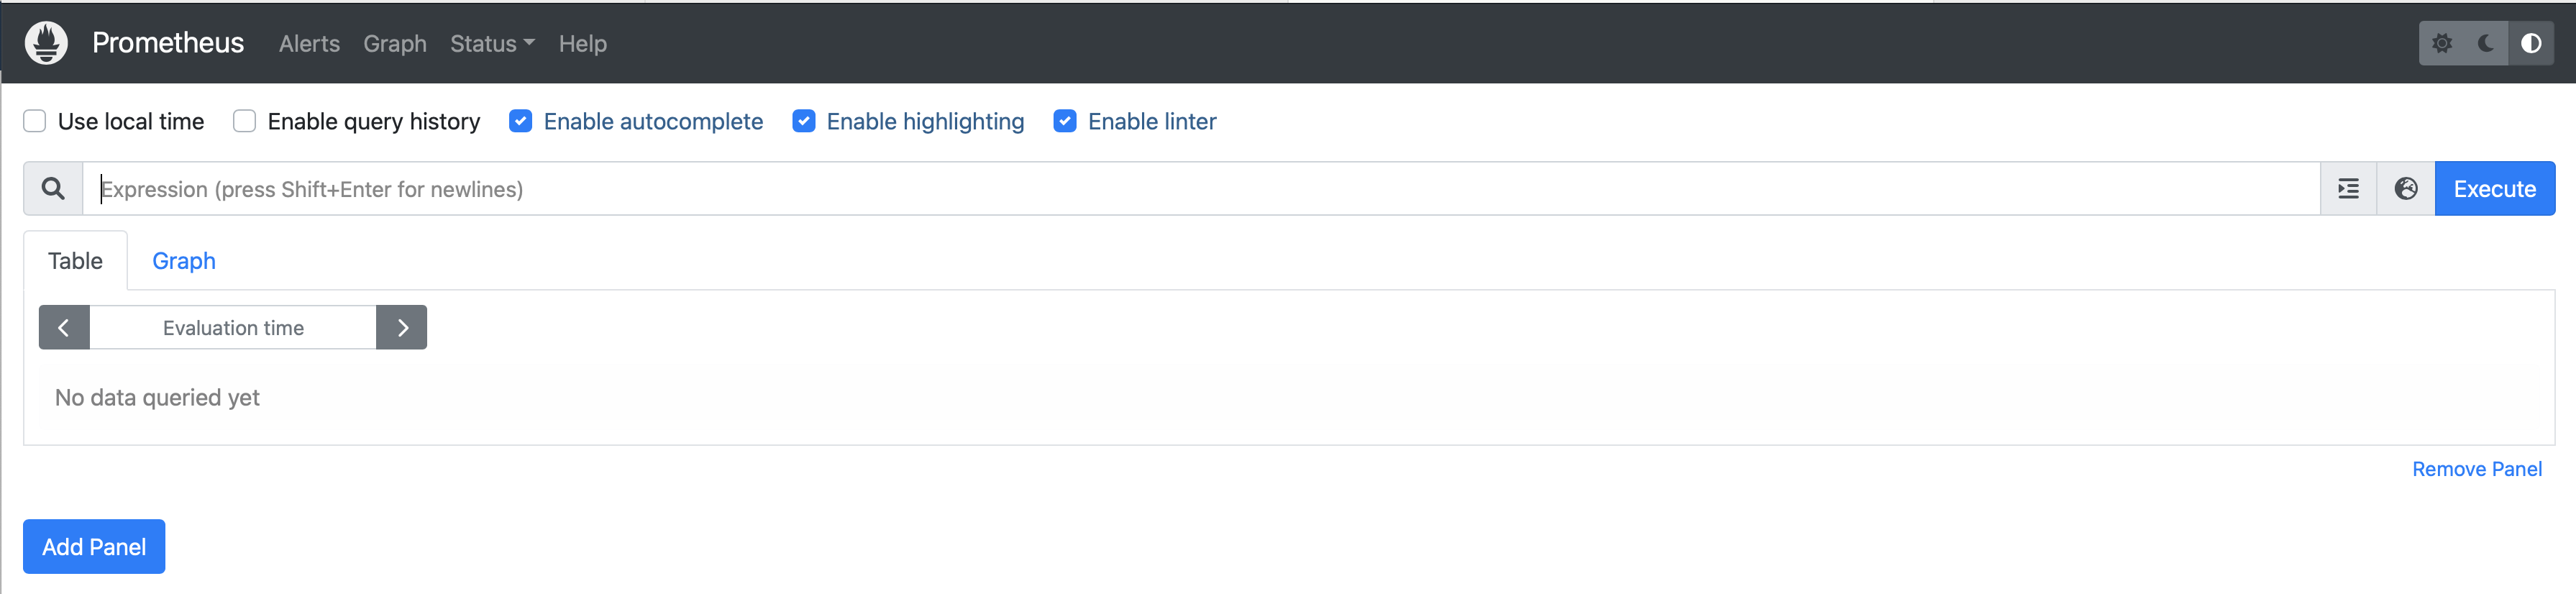
使用 localhost:9090 可访问 prometheus 实例:
Grafana 的安装
同理,用 docker 拉起一个 Grafana 实例:
$ docker run -d -p 3000:3000 grafana/grafana-enterprise
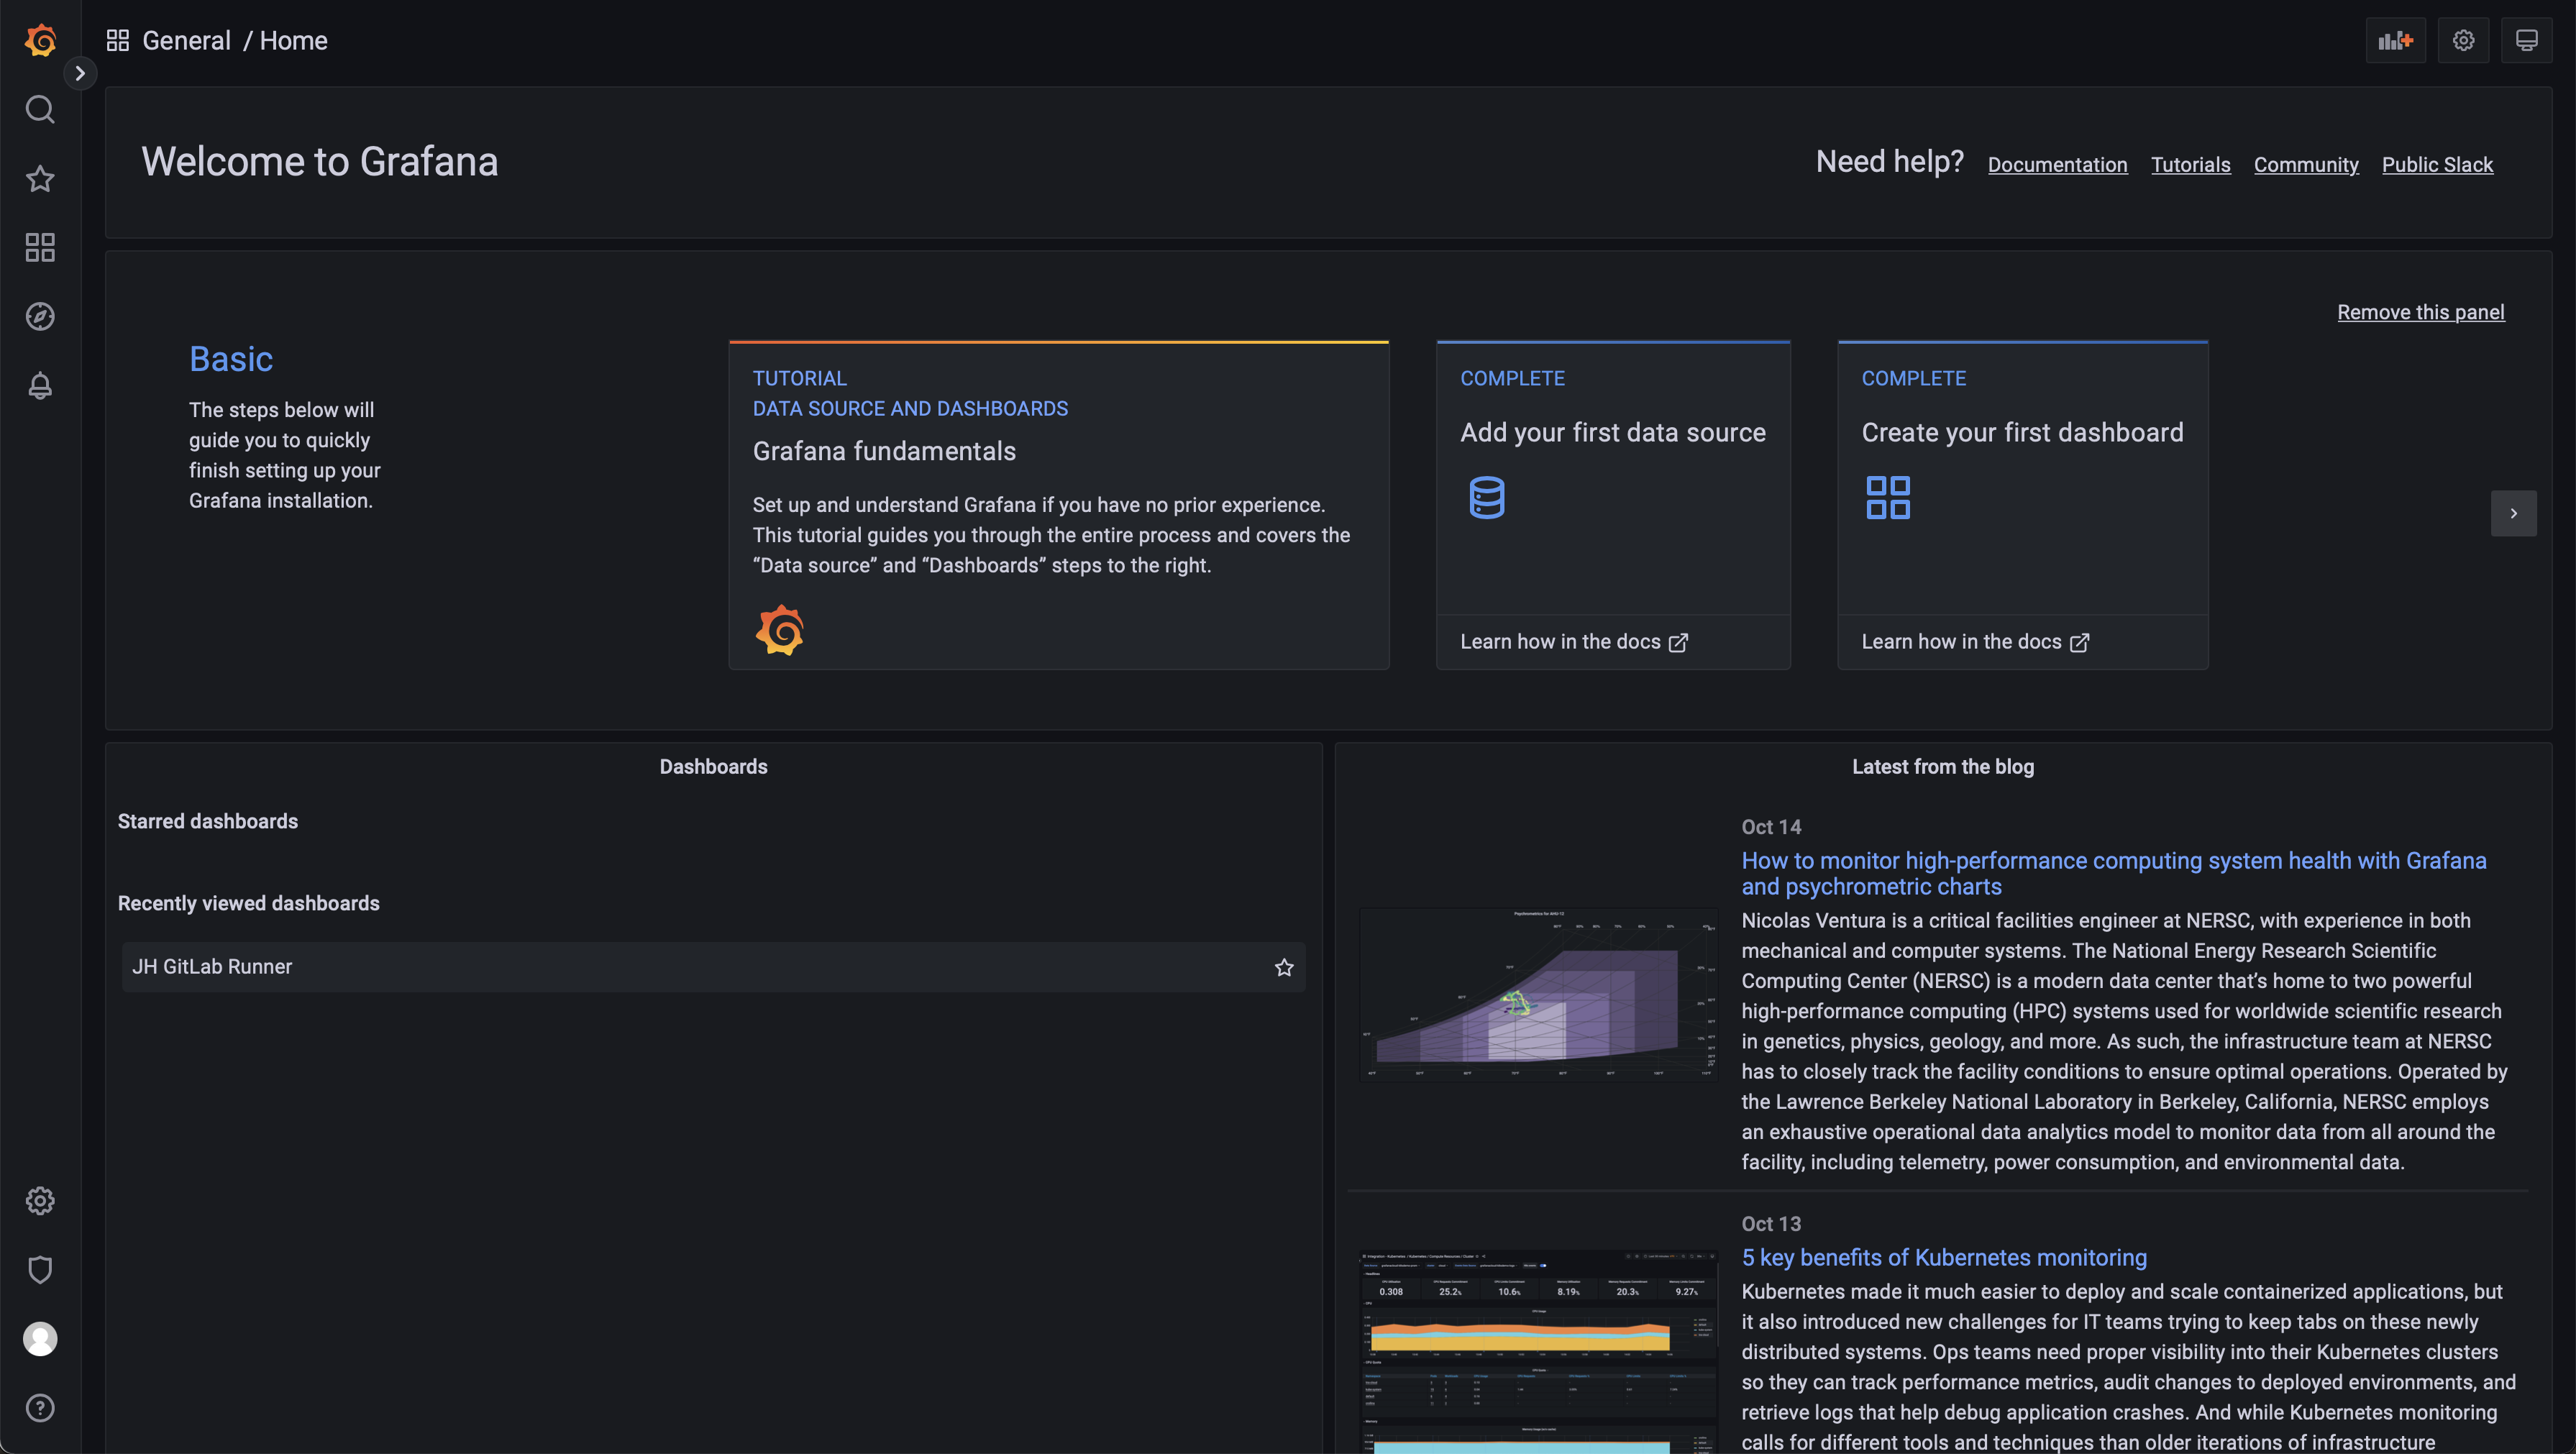
使用 admin/admin 登陆 localhost:3030:
建议安装成功之后立即修改 grafana 的初始密码,比如集成 LDAP,成为强密码,防止被破解进而遭受攻击。
Runner 的监控配置
Prometheus & Grafana 的配置
通过 Grafana 来实现极狐GitLab Runner 监控和可观测性的原理图如下:

Runner 通过 9252 端口输出 metrics,Prometheus 通过 Job 来抓取(scrape) Runner 的 metrics,最后 Grafana 通过数据源(Prometheus)来完成 metrics 的展示。
配置层面,在 Runner 上需要开启 9252 端口,配置 listen_address 端口即可。对于 Prometheus 需要配置一个抓取 Runner metrics 的 Job 即可:
scrape_configs:
  - job_name: "jh gitlab runner"
    static_configs:
      - targets: ["YOUR-Runner-IP:9252"]
  - job_name: "prometheus"
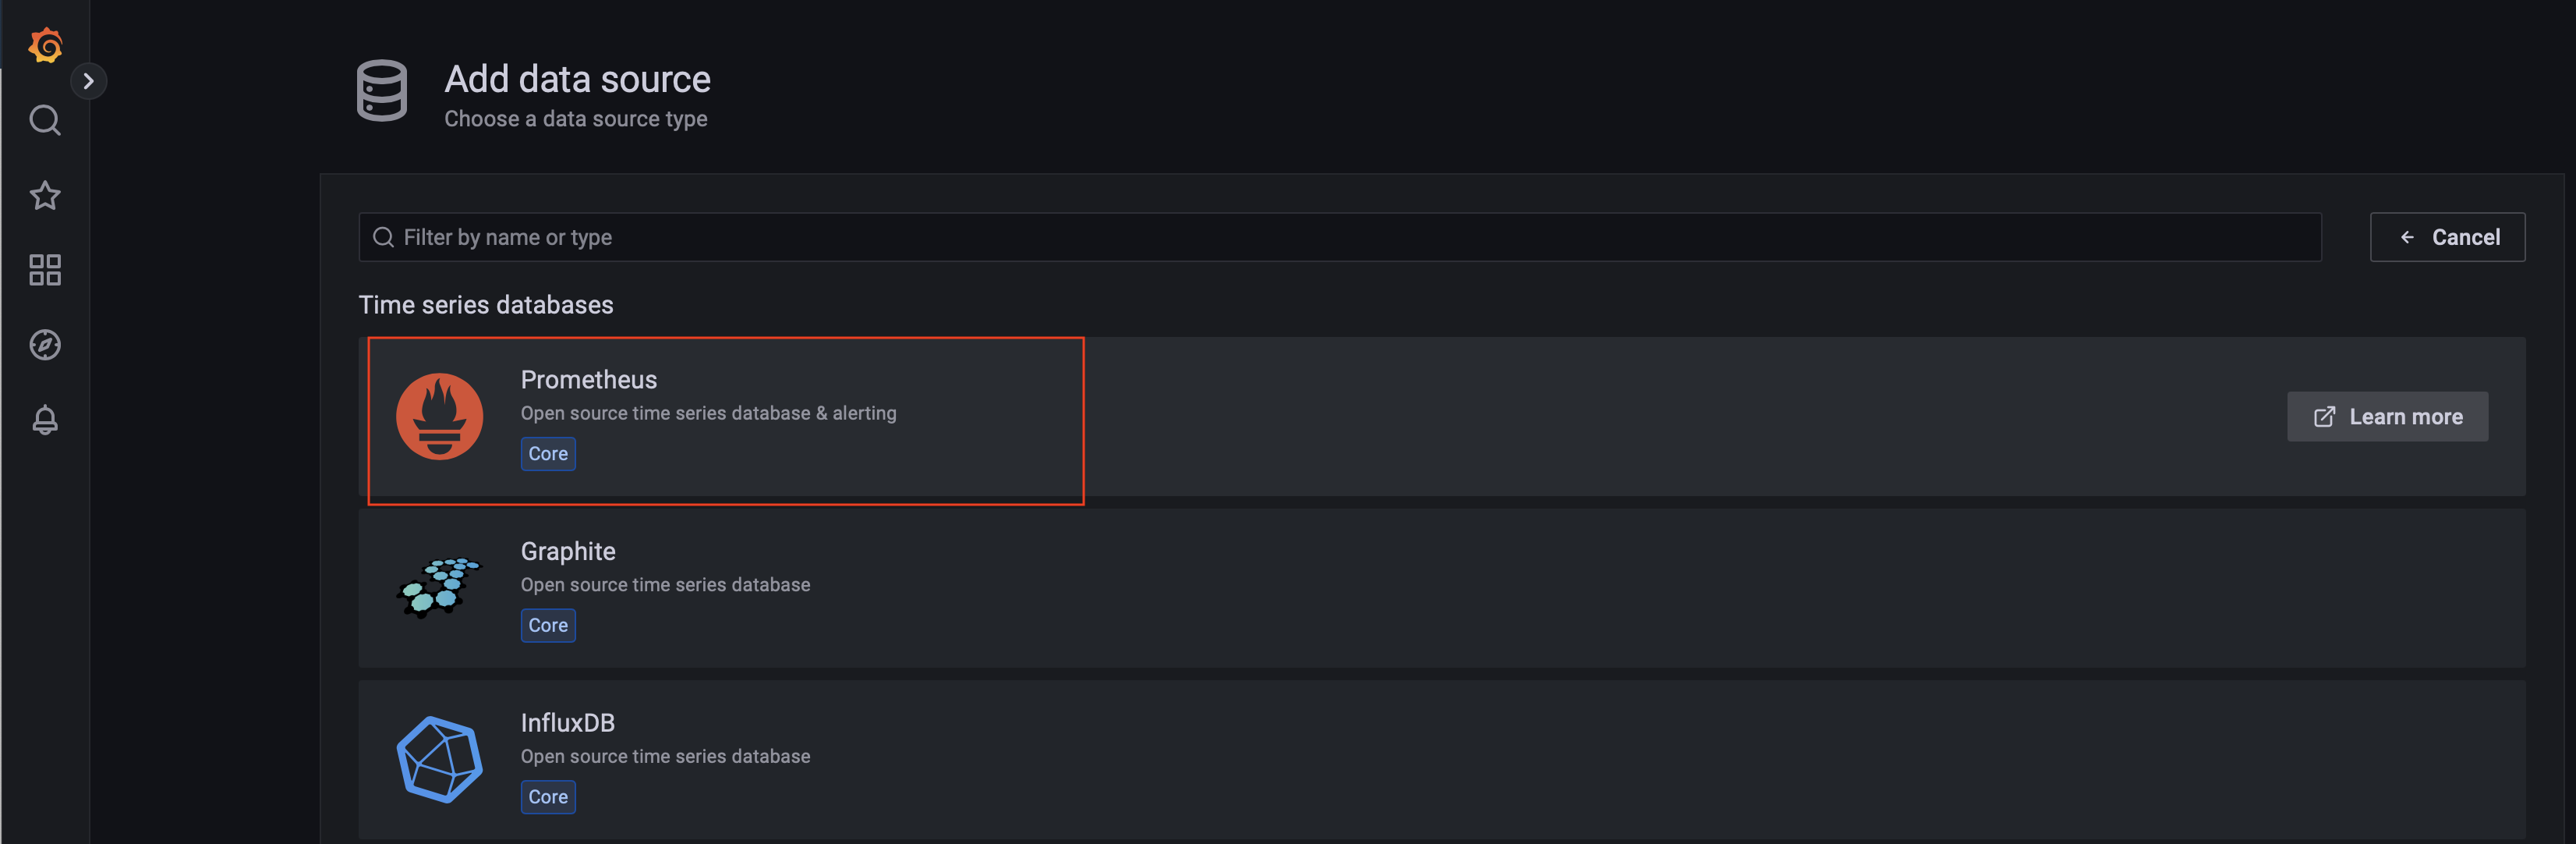
在 Grafana 上面需要添加一个 Prometheus 的 Data Source,Configuration → Data Source 中选择 Add data source:
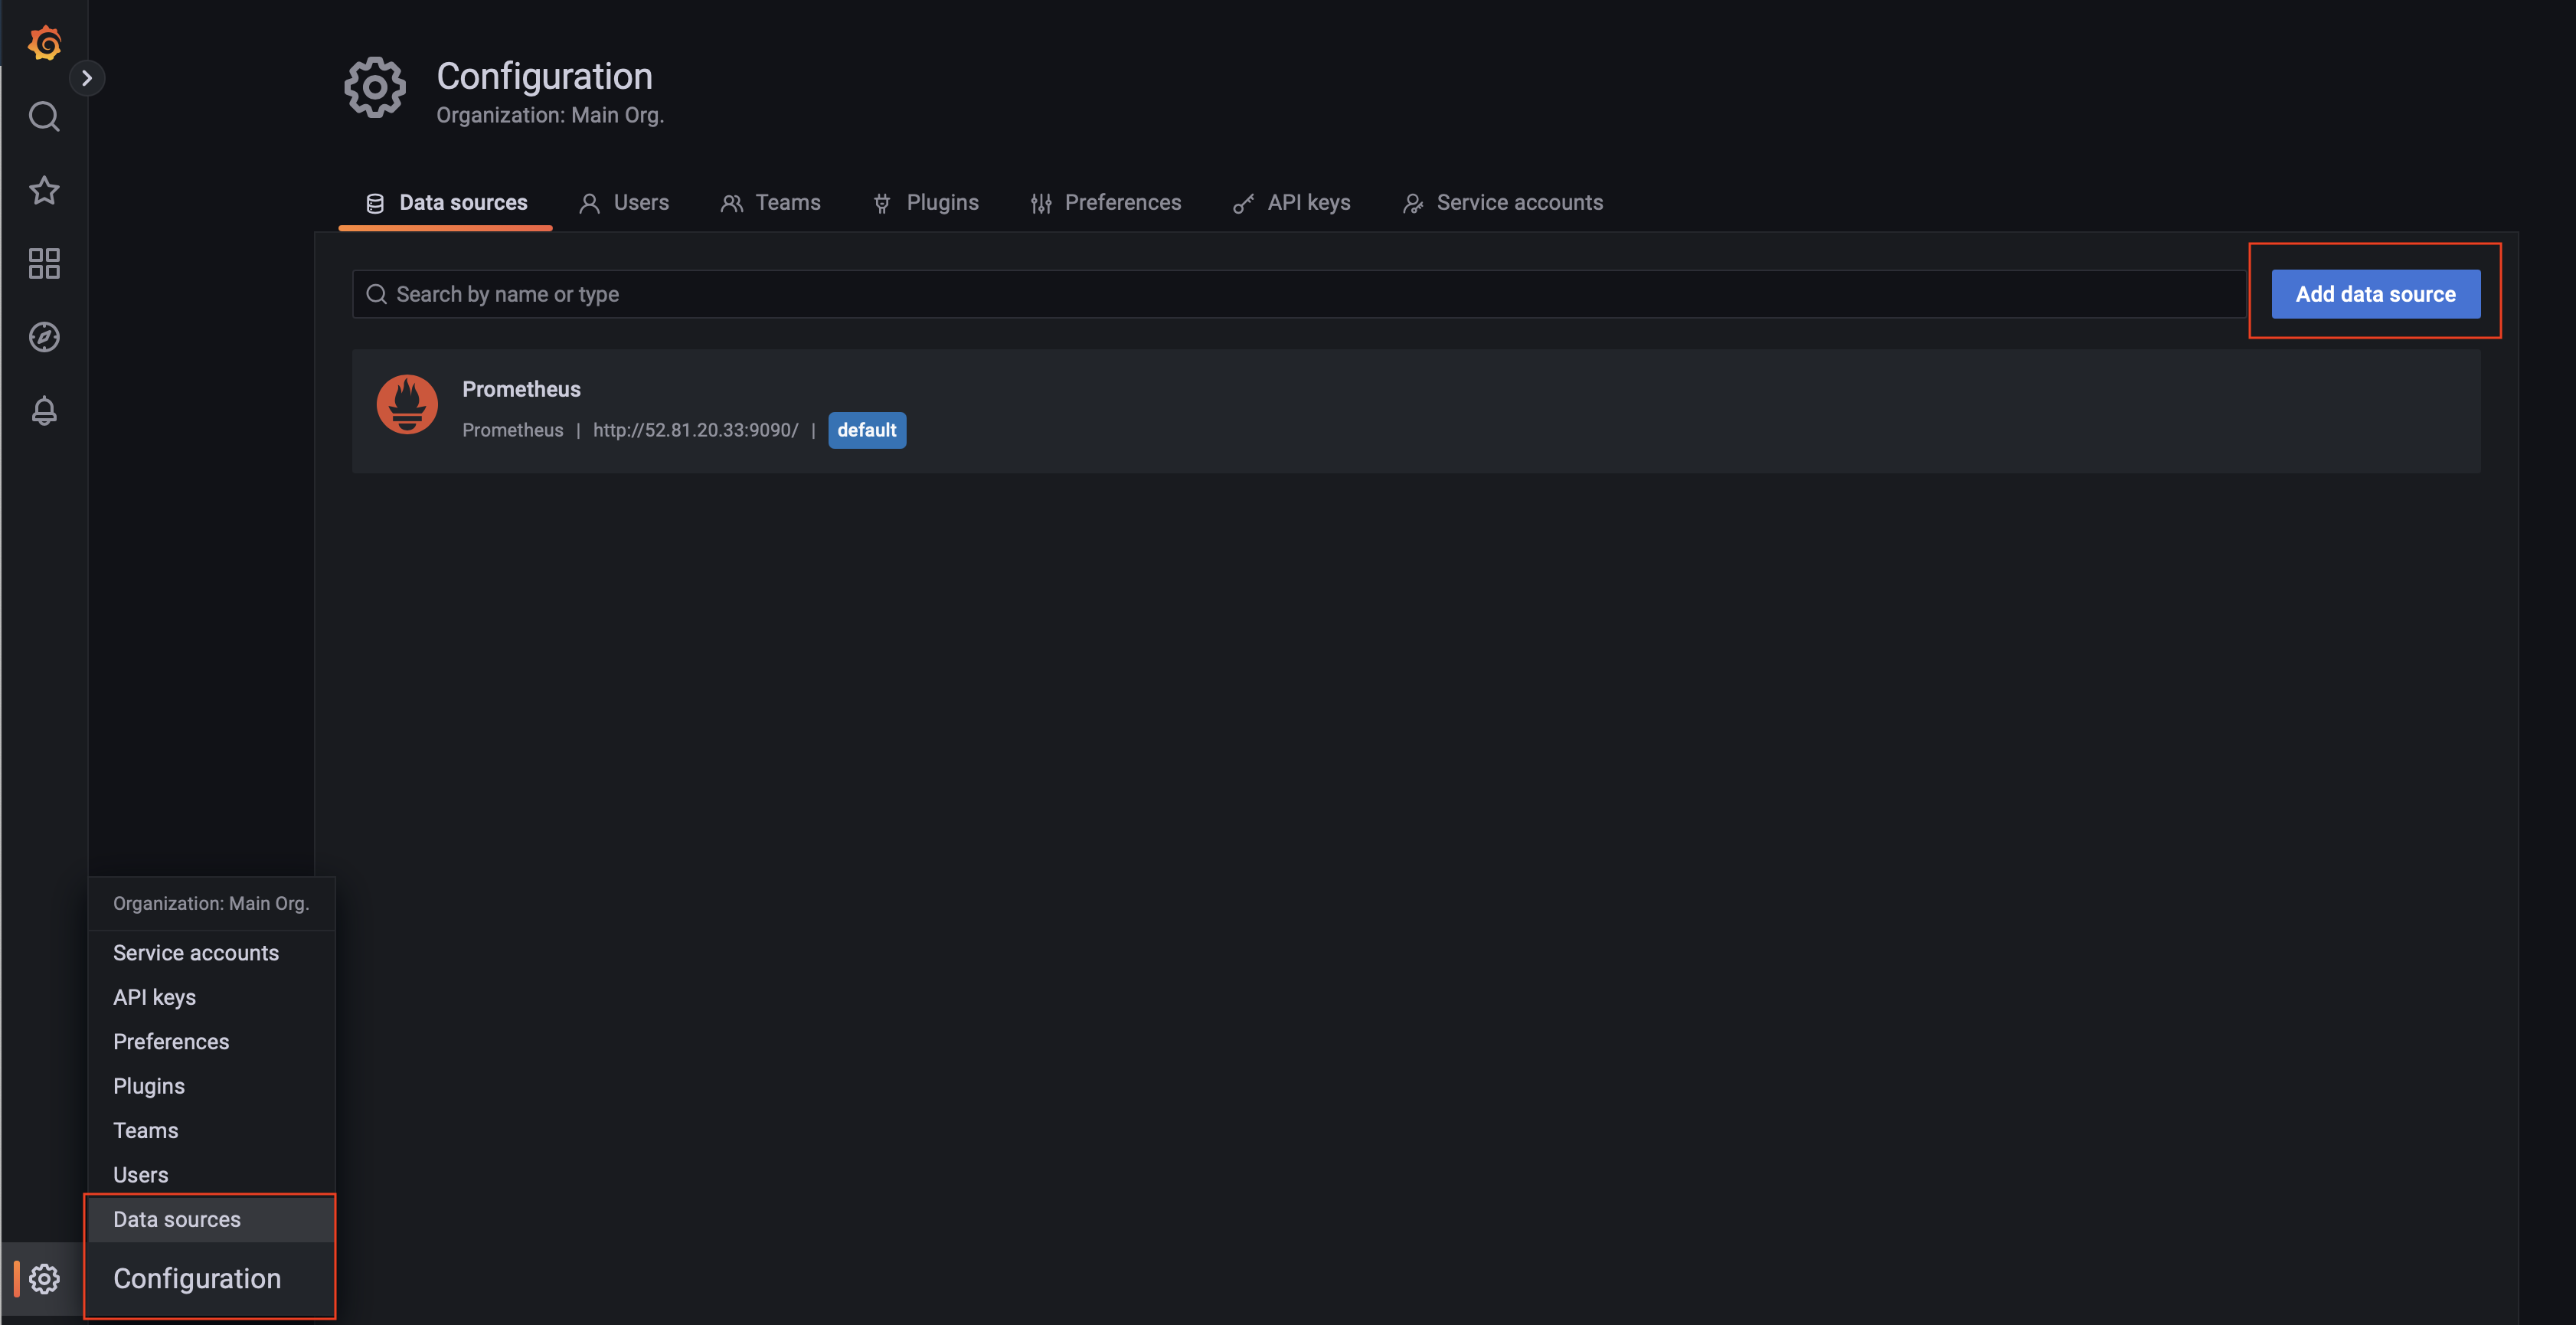
选择 Prometheus 即可:
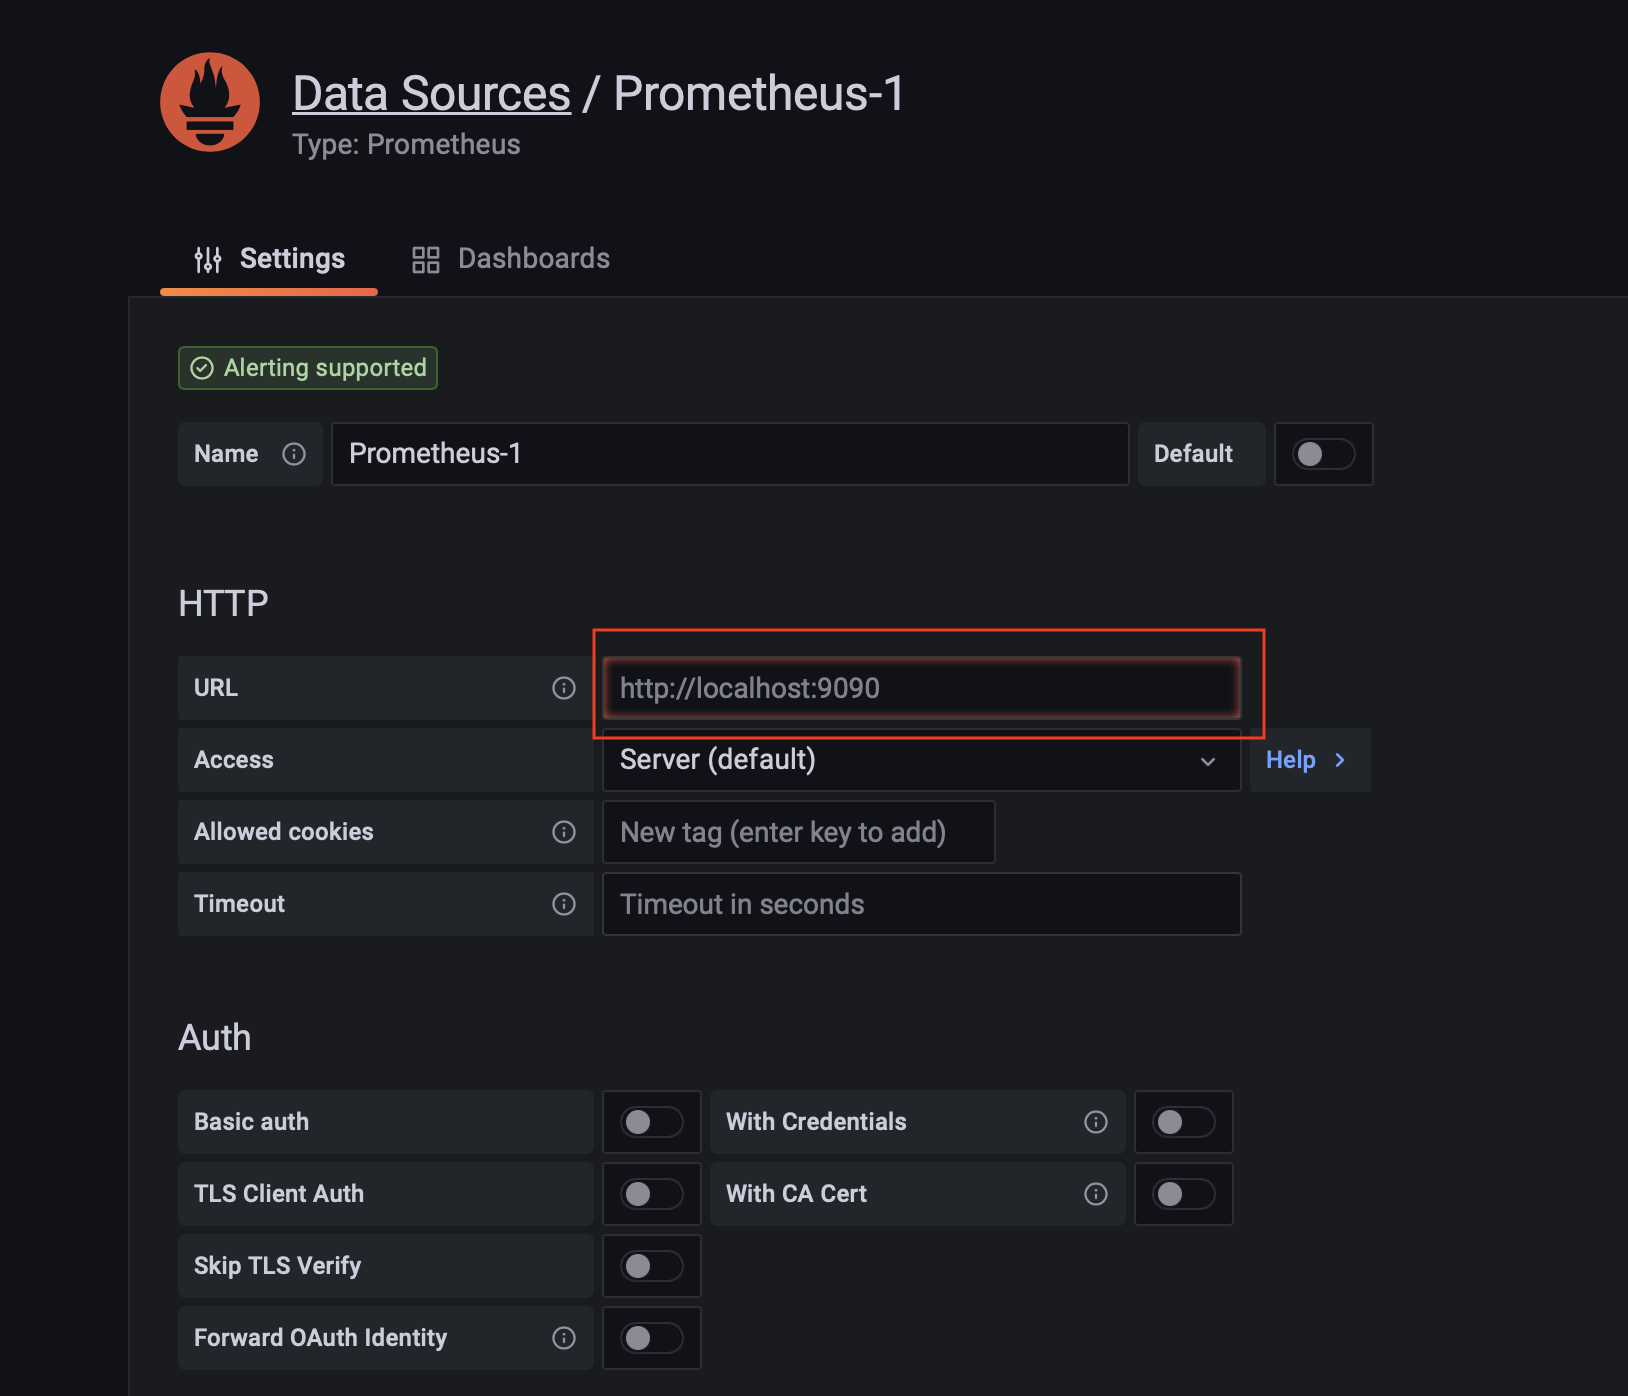
接着配置 Promehteus 的信息,诸如 URL、Auth(如果有需要)等信息,最后选择 Save & Test:
Runner Dashboard 的配置
Grafana Lab 有极狐GitLab Runner Dashboard,可以直接导入 Grafana,Dashboard → Import:
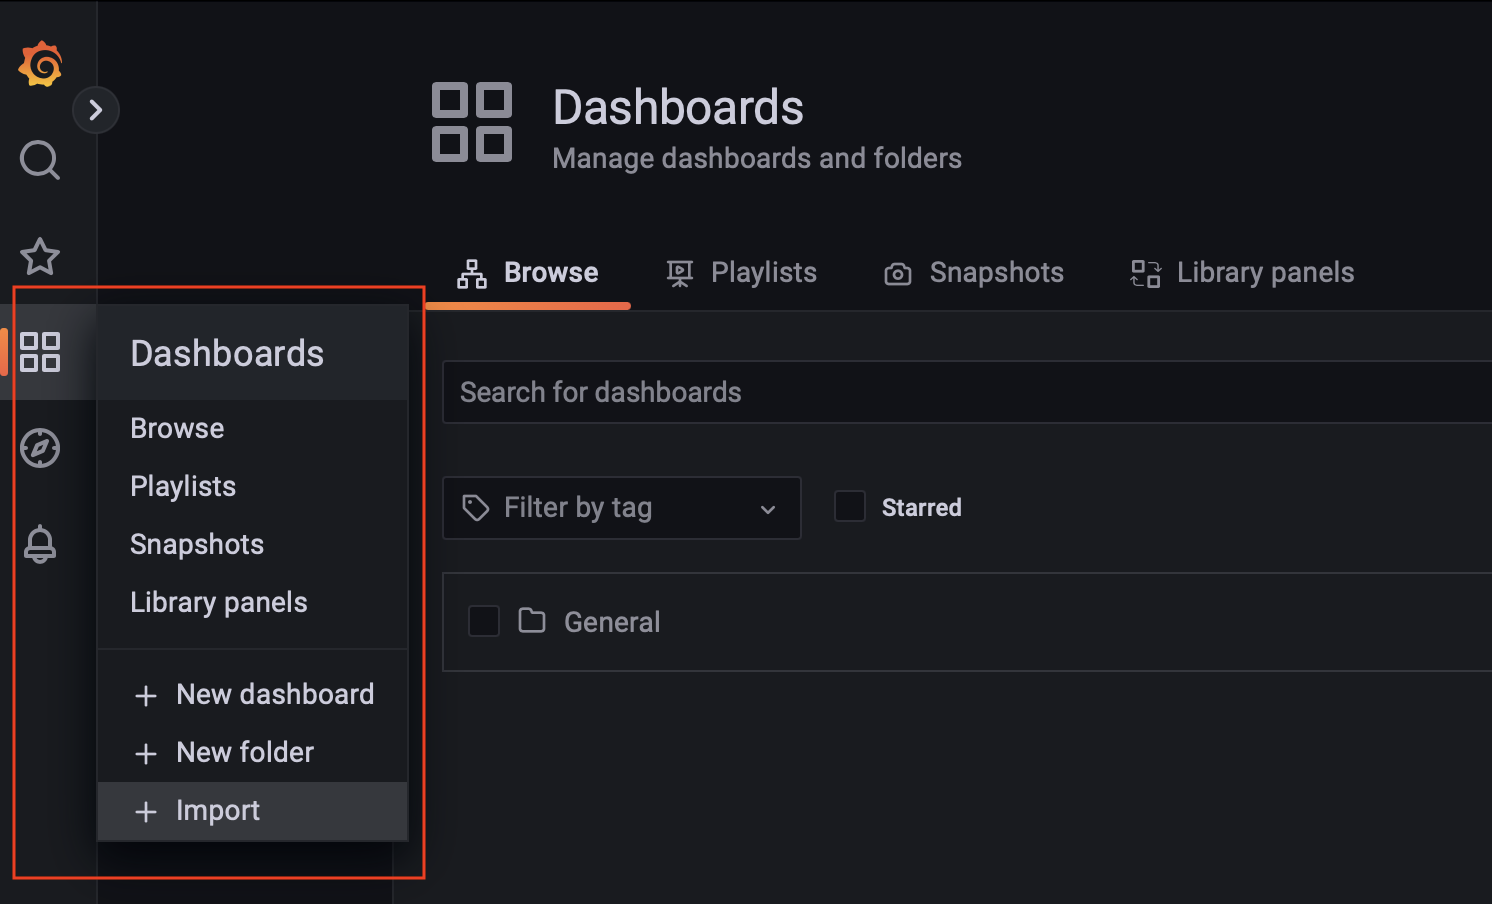
点击 Import:
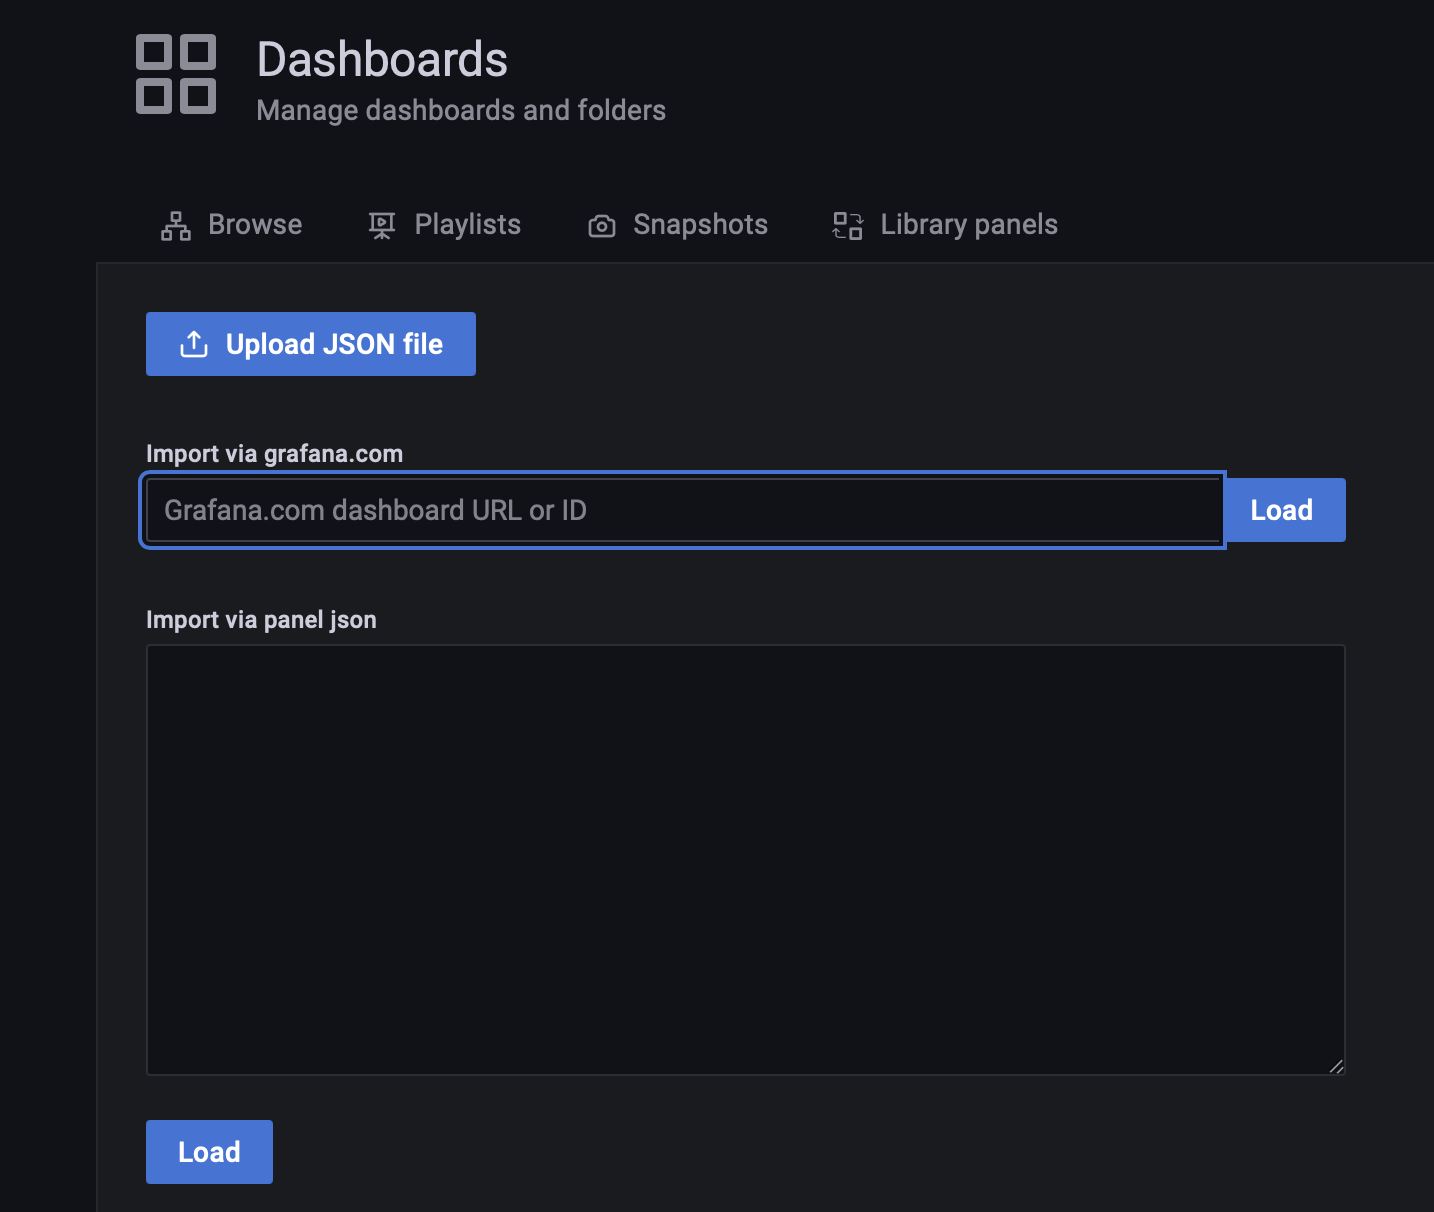
输入极狐GitLab Runner Dashboard ID(9631)导入即可,接着就可以看到 Runner 的 Dashboard 呈现界面了:
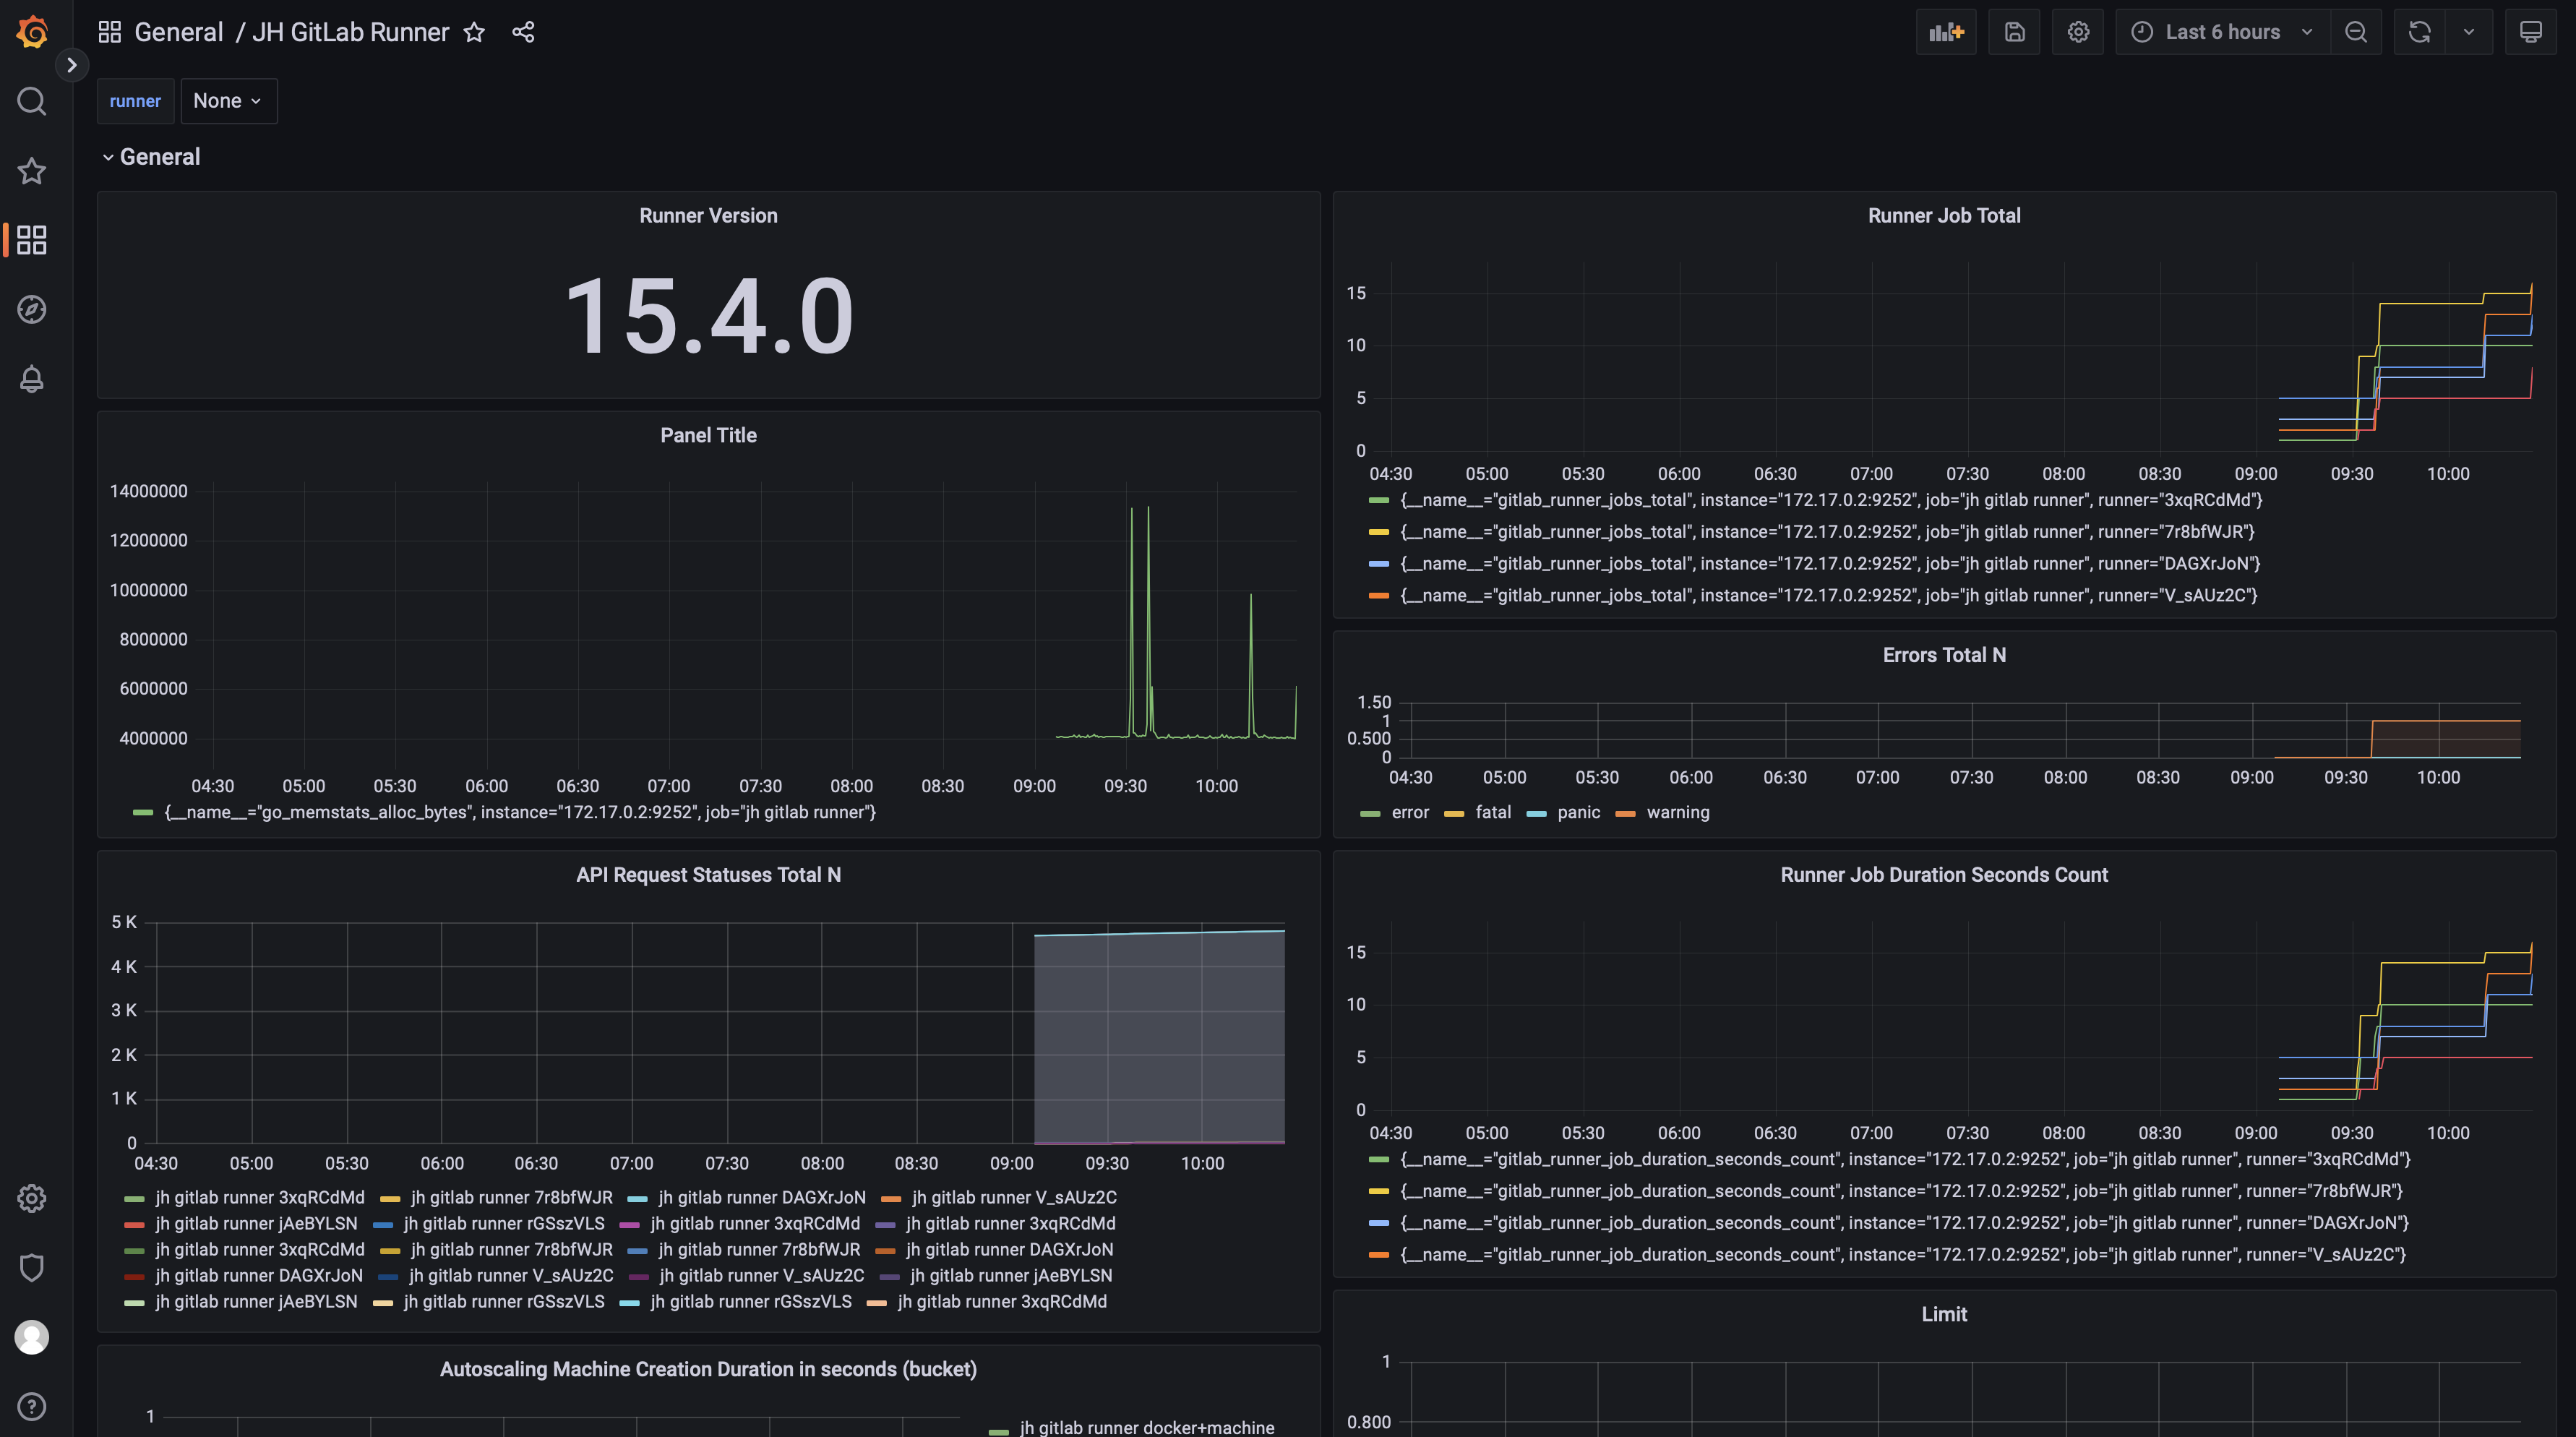
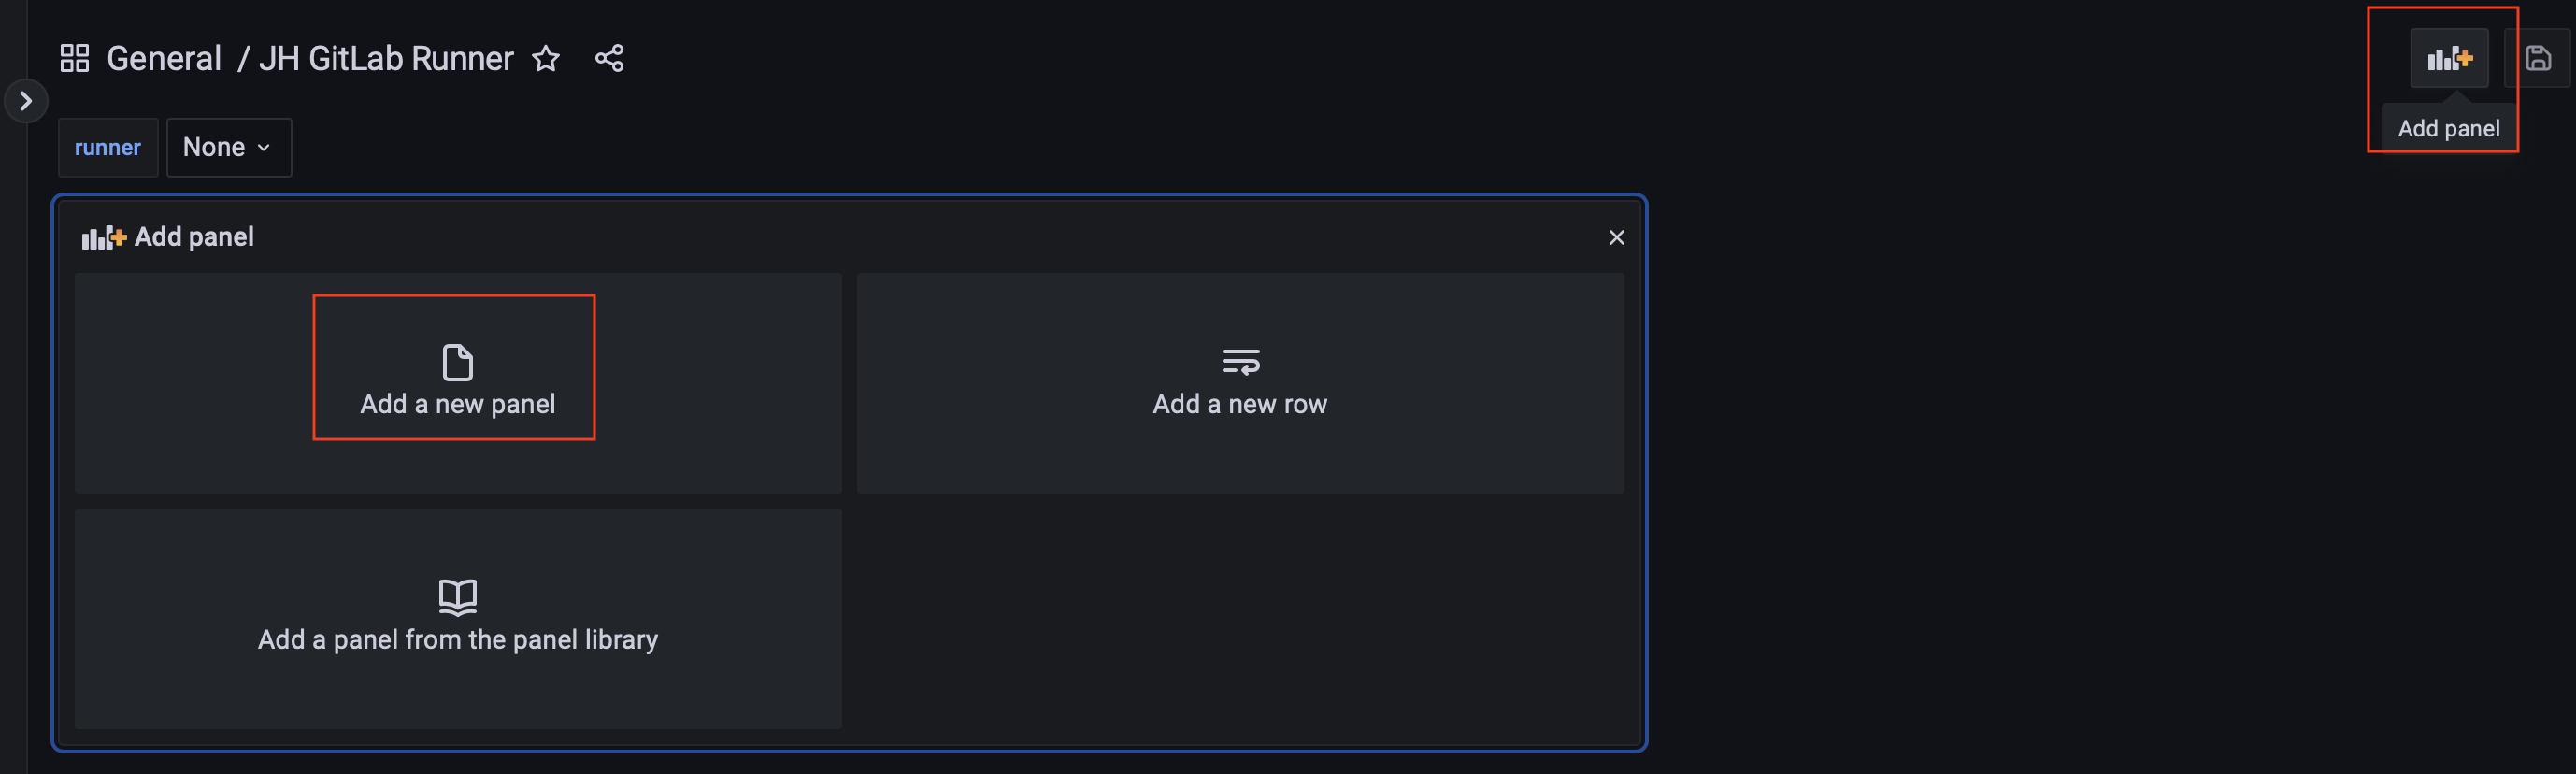
由于极狐GitLab Runner 的 metrics 数量较多,Dashboard 导入之后只有一部分可见,这种情况可以通过自己添加 Panel 来实现。在 Dashboard 上点击 Add panel,选择 Add a new panel:
在 Metric 中选择需要想要监控的指标,诸如选择 gitlab_runner_request_concurrency,在 label 中选择抓取 metrics 的 job 名称即可:
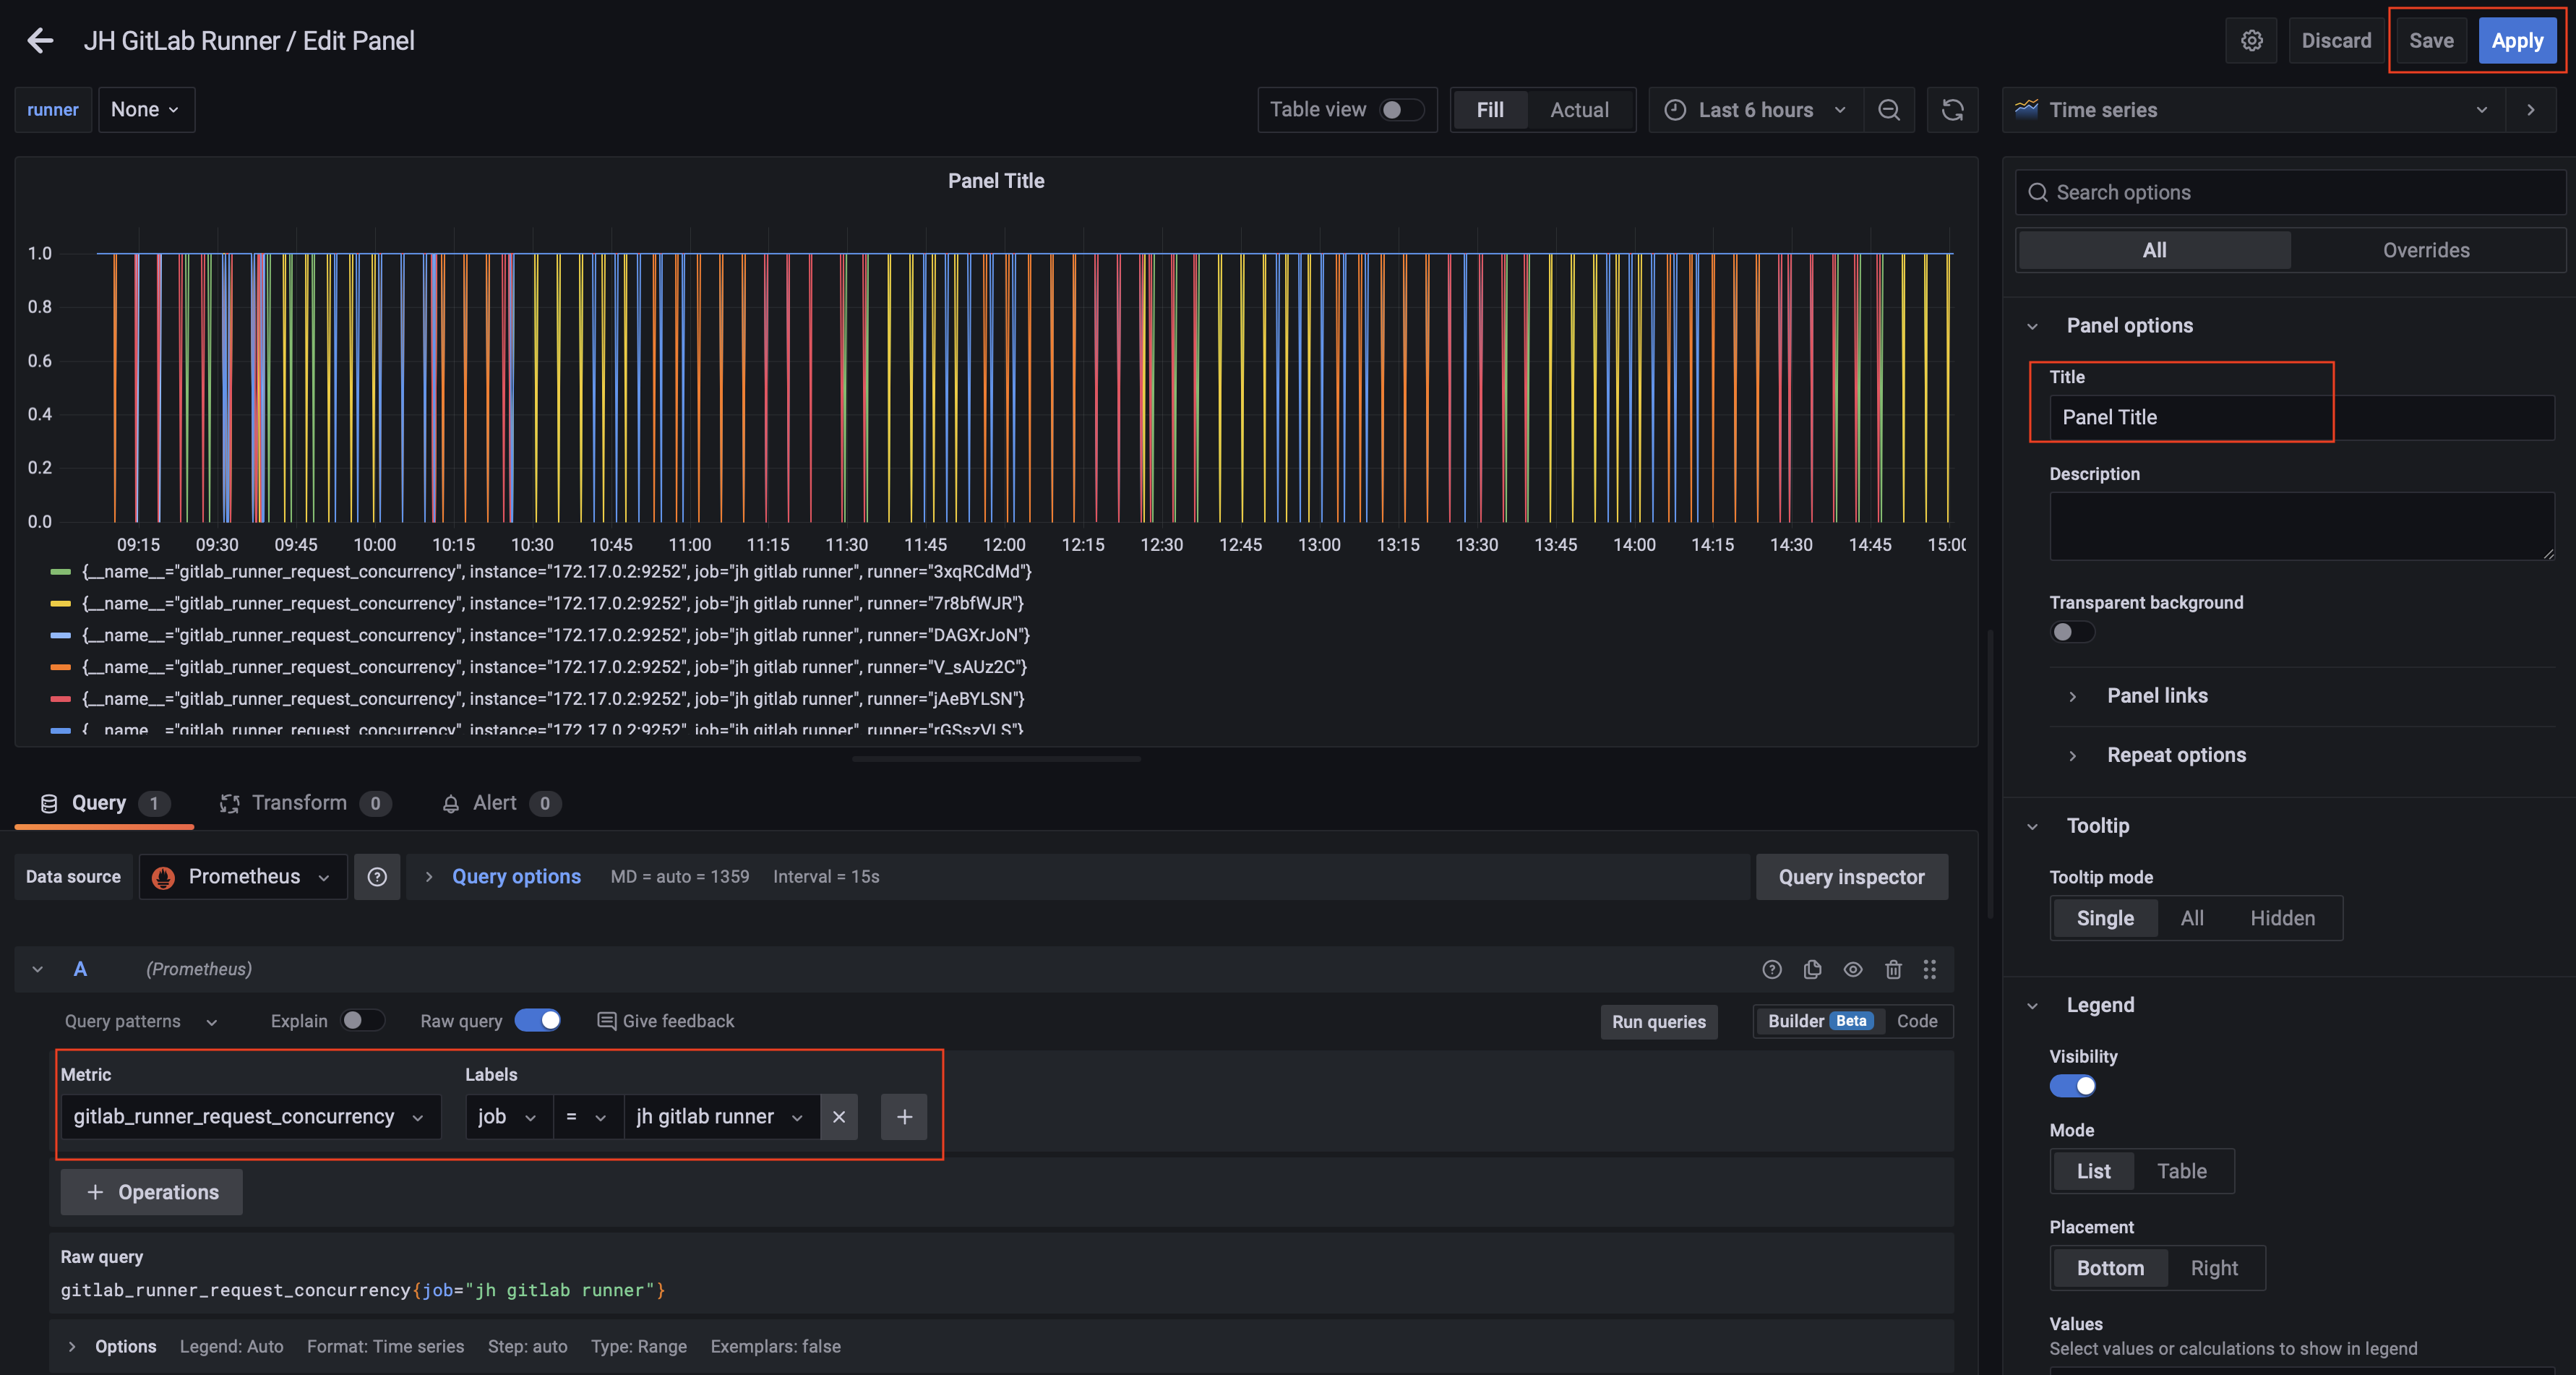
点击 Svae 即可。如果想要其他的 metrics 并进行监控和展示,用同样的方法添加 Panel 即可。