{{< details >}}
- Tier: 基础版, 专业版, 旗舰版
- Offering: 私有化部署
{{< /details >}}
极狐GitLab 实例为大多数请求记录了一个唯一的请求跟踪 ID(称为 “correlation ID”)。每个单独的请求都会获得其自己的 correlation ID,然后该 ID 会记录在每个极狐GitLab 组件的日志中。这使得在分布式系统中跟踪行为变得更加容易。没有这个 ID,很难或几乎不可能匹配相关的日志条目。
识别请求的 correlation ID
correlation ID 在结构化日志中以键 correlation_id 记录,并在极狐GitLab 发送的所有响应头中以 x-request-id 头记录。您可以通过在任一位置搜索来找到您的 correlation ID。
在浏览器中获取 correlation ID
您可以使用浏览器的开发者工具来监控和检查您正在访问的网站的网络活动。
要定位相关请求并查看其 correlation ID:
- 在网络监视器中启用持久日志记录。极狐GitLab 中的一些操作在您提交表单后会快速重定向,因此这有助于捕获所有相关活动。
- 为了帮助隔离您要查找的请求,您可以筛选
document请求。 - 选择感兴趣的请求以查看详细信息。
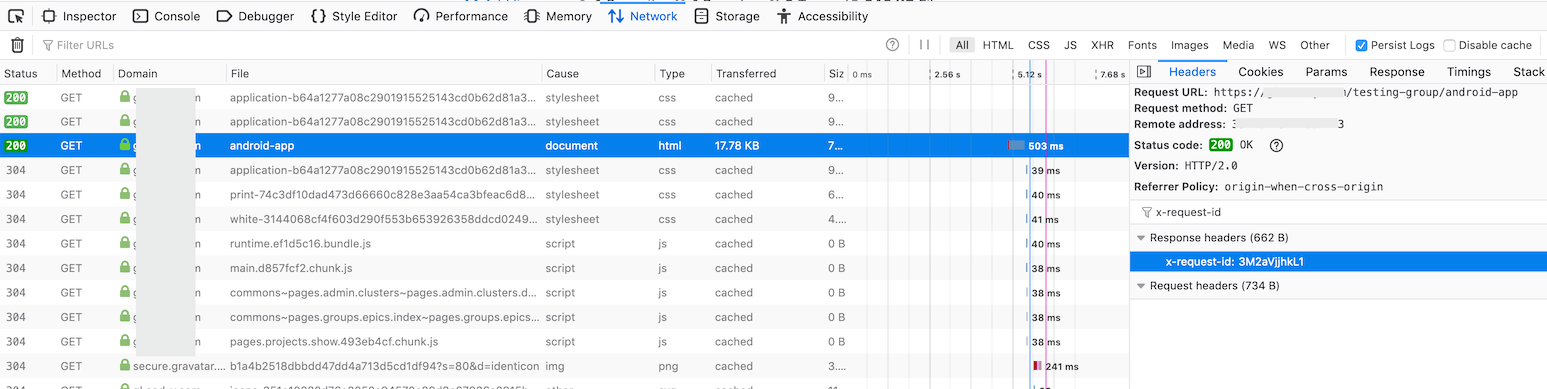
- 转到 Headers 部分并查找 Response Headers。在那里您应该找到一个
x-request-id头,其值是极狐GitLab 为请求随机生成的。
请参阅以下示例:
从日志中获取 correlation ID
找到正确的 correlation ID 的另一种方法是搜索或查看您的日志,并找到您正在监视的日志条目的 correlation_id 值。
例如,假设您想了解在极狐GitLab 中重现操作时发生了什么或中断了什么。您可以跟踪极狐GitLab 日志,筛选用户请求,然后观看请求,直到看到您感兴趣的内容。
从 curl 获取 correlation ID
如果您使用 curl,则可以使用详细选项显示请求和响应头以及其他调试信息。
➜  ~ curl --verbose "https://gitlab.example.com/api/v4/projects"
# look for a line that looks like this
< x-request-id: 4rAMkV3gof4
使用 jq
此示例使用 jq 来过滤结果并显示我们最有可能关心的值。
sudo gitlab-ctl tail gitlab-rails/production_json.log | jq 'select(.username == "bob") | "User: \(.username), \(.method) \(.path), \(.controller)#\(.action), ID: \(.correlation_id)"'
"User: bob, GET /root/linux, ProjectsController#show, ID: U7k7fh6NpW3"
"User: bob, GET /root/linux/commits/master/signatures, Projects::CommitsController#signatures, ID: XPIHpctzEg1"
"User: bob, GET /root/linux/blob/master/README, Projects::BlobController#show, ID: LOt9hgi1TV4"
使用 grep
此示例仅使用 grep 和 tr,它们比 jq 更有可能被安装。
sudo gitlab-ctl tail gitlab-rails/production_json.log | grep '"username":"bob"' | tr ',' '\n' | egrep 'method|path|correlation_id'
{"method":"GET"
"path":"/root/linux"
"username":"bob"
"correlation_id":"U7k7fh6NpW3"}
{"method":"GET"
"path":"/root/linux/commits/master/signatures"
"username":"bob"
"correlation_id":"XPIHpctzEg1"}
{"method":"GET"
"path":"/root/linux/blob/master/README"
"username":"bob"
"correlation_id":"LOt9hgi1TV4"}
在日志中搜索 correlation ID
当您有了 correlation ID 后,您可以开始搜索相关的日志条目。您可以通过 correlation ID 本身来过滤行。结合使用 find 和 grep 应该足以找到您要查找的条目。
# find <gitlab log directory> -type f -mtime -0 exec grep '<correlation ID>' '{}' '+'
find /var/log/gitlab -type f -mtime 0 -exec grep 'LOt9hgi1TV4' '{}' '+'
/var/log/gitlab/gitlab-workhorse/current:{"correlation_id":"LOt9hgi1TV4","duration_ms":2478,"host":"gitlab.domain.tld","level":"info","method":"GET","msg":"access","proto":"HTTP/1.1","referrer":"https://gitlab.domain.tld/root/linux","remote_addr":"68.0.116.160:0","remote_ip":"[filtered]","status":200,"system":"http","time":"2019-09-17T22:17:19Z","uri":"/root/linux/blob/master/README?format=json\u0026viewer=rich","user_agent":"Mozilla/5.0 (Mac) Gecko Firefox/69.0","written_bytes":1743}
/var/log/gitlab/gitaly/current:{"correlation_id":"LOt9hgi1TV4","grpc.code":"OK","grpc.meta.auth_version":"v2","grpc.meta.client_name":"gitlab-web","grpc.method":"FindCommits","grpc.request.deadline":"2019-09-17T22:17:47Z","grpc.request.fullMethod":"/gitaly.CommitService/FindCommits","grpc.request.glProjectPath":"root/linux","grpc.request.glRepository":"project-1","grpc.request.repoPath":"@hashed/6b/86/6b86b273ff34fce19d6b804eff5a3f5747ada4eaa22f1d49c01e52ddb7875b4b.git","grpc.request.repoStorage":"default","grpc.request.topLevelGroup":"@hashed","grpc.service":"gitaly.CommitService","grpc.start_time":"2019-09-17T22:17:17Z","grpc.time_ms":2319.161,"level":"info","msg":"finished streaming call with code OK","peer.address":"@","span.kind":"server","system":"grpc","time":"2019-09-17T22:17:19Z"}
/var/log/gitlab/gitlab-rails/production_json.log:{"method":"GET","path":"/root/linux/blob/master/README","format":"json","controller":"Projects::BlobController","action":"show","status":200,"duration":2448.77,"view":0.49,"db":21.63,"time":"2019-09-17T22:17:19.800Z","params":[{"key":"viewer","value":"rich"},{"key":"namespace_id","value":"root"},{"key":"project_id","value":"linux"},{"key":"id","value":"master/README"}],"remote_ip":"[filtered]","user_id":2,"username":"bob","ua":"Mozilla/5.0 (Mac) Gecko Firefox/69.0","queue_duration":3.38,"gitaly_calls":1,"gitaly_duration":0.77,"rugged_calls":4,"rugged_duration_ms":28.74,"correlation_id":"LOt9hgi1TV4"}
在分布式架构中搜索
如果您在极狐GitLab 基础设施中进行了水平扩展,则必须在所有极狐GitLab 节点中进行搜索。您可以使用某种日志聚合软件,如 Loki、ELK、Splunk 或其他工具。
您可以使用像 Ansible 或 PSSH(并行 SSH)这样的工具来在服务器中并行执行相同的命令,或者自行构建解决方案。
在性能栏中查看请求
您可以使用 性能栏 查看包括对 SQL 和 Gitaly 的调用在内的有趣数据。
要查看数据,请求的 correlation ID 必须与查看性能栏的用户的会话相匹配。对于 API 请求,这意味着您必须使用经过身份验证的用户的会话 cookie 执行请求。
例如,如果您想查看为以下 API 端点执行的数据库查询:
https://gitlab.com/api/v4/groups/2564205/projects?with_security_reports=true&page=1&per_page=1
首先,启用 开发者工具 面板。有关如何执行此操作的详细信息,请参阅 在浏览器中获取 correlation ID。
启用开发者工具后,按以下步骤获取会话 cookie:
- 登录状态下访问 https://gitlab.com。
- 可选。在 开发者工具 面板中选择 Fetch/XHR 请求过滤器。此步骤是为 Google Chrome 开发者工具描述的,并非绝对必要,但可以更容易地找到正确的请求。
- 在左侧选择
results?request_id=<some-request-id>请求。 - 会话 cookie 显示在
Headers面板的Request Headers部分。右键单击 cookie 值并选择Copy value。
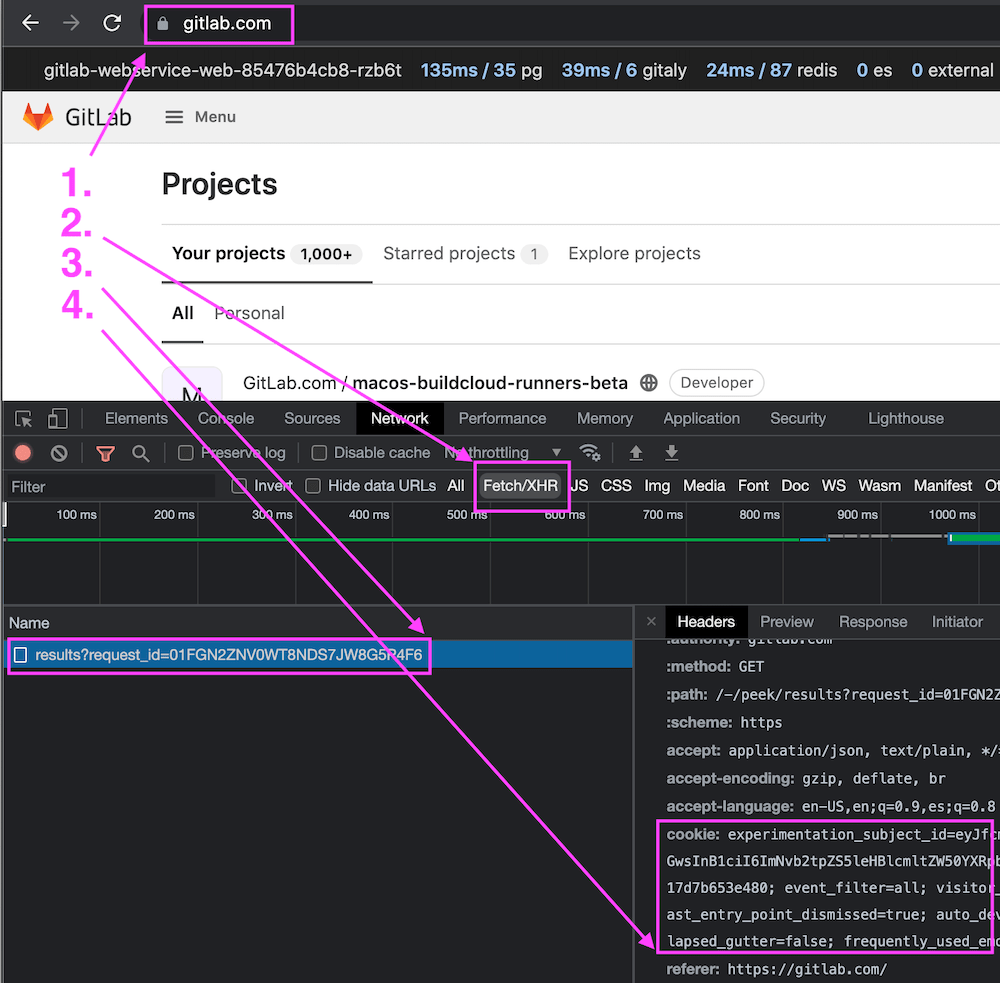
您已将会话 cookie 的值复制到剪贴板,例如:
experimentation_subject_id=<subject-id>; _gitlab_session=<session-id>; event_filter=all; visitor_id=<visitor-id>; perf_bar_enabled=true; sidebar_collapsed=true; diff_view=inline; sast_entry_point_dismissed=true; auto_devops_settings_dismissed=true; cf_clearance=<cf-clearance>; collapsed_gutter=false
使用会话 cookie 的值通过将其粘贴到 curl 请求的自定义头中来构建 API 请求:
$ curl --include "https://gitlab.com/api/v4/groups/2564205/projects?with_security_reports=true&page=1&per_page=1" \
--header 'cookie: experimentation_subject_id=<subject-id>; _gitlab_session=<session-id>; event_filter=all; visitor_id=<visitor-id>; perf_bar_enabled=true; sidebar_collapsed=true; diff_view=inline; sast_entry_point_dismissed=true; auto_devops_settings_dismissed=true; cf_clearance=<cf-clearance>; collapsed_gutter=false'

  date: Tue, 28 Sep 2021 03:55:33 GMT
  content-type: application/json
  ...
  x-request-id: 01FGN8P881GF2E5J91JYA338Y3
  ...
  [
    {
      "id":27497069,
      "description":"Analyzer for images used on live K8S containers based on Starboard"
    },
    "container_registry_image_prefix":"registry.gitlab.com/gitlab-org/security-products/analyzers/cluster-image-scanning",
    "..."
  ]
响应包含 API 端点的数据,以及在 x-request-id 头中返回的 correlation_id 值,如 识别请求的 correlation ID 部分所述。
然后,您可以查看此请求的数据库详细信息:
-
将
x-request-id值粘贴到 性能栏 的request details字段中,然后按 Enter/Return。此示例使用上述响应返回的x-request-id值01FGN8P881GF2E5J91JYA338Y3:
-
在性能栏的右侧
Request Selector下拉列表中插入一个新的请求。选择新请求以查看 API 请求的指标:
-
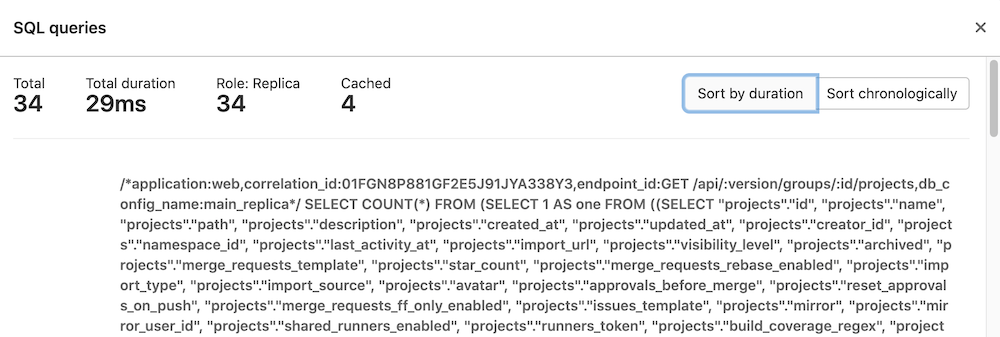
在性能栏中选择
pg链接以查看 API 请求执行的数据库查询:
显示数据库查询对话框: